|
Getting your Trinity Audio player ready...
|
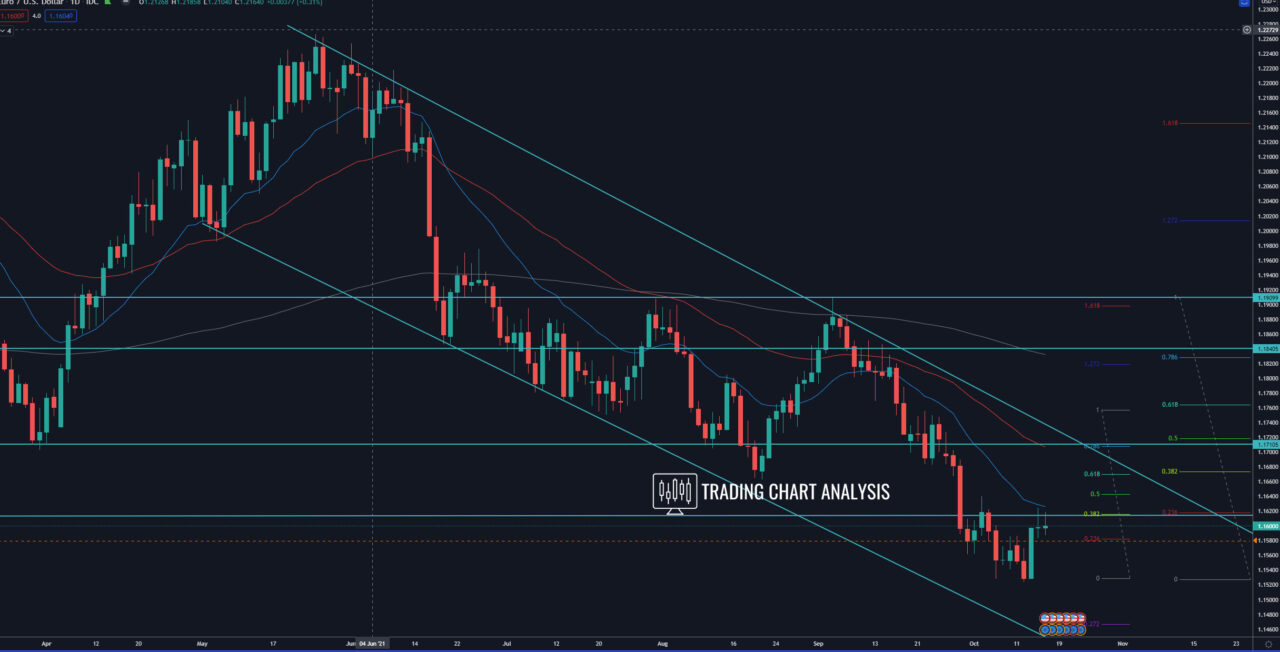
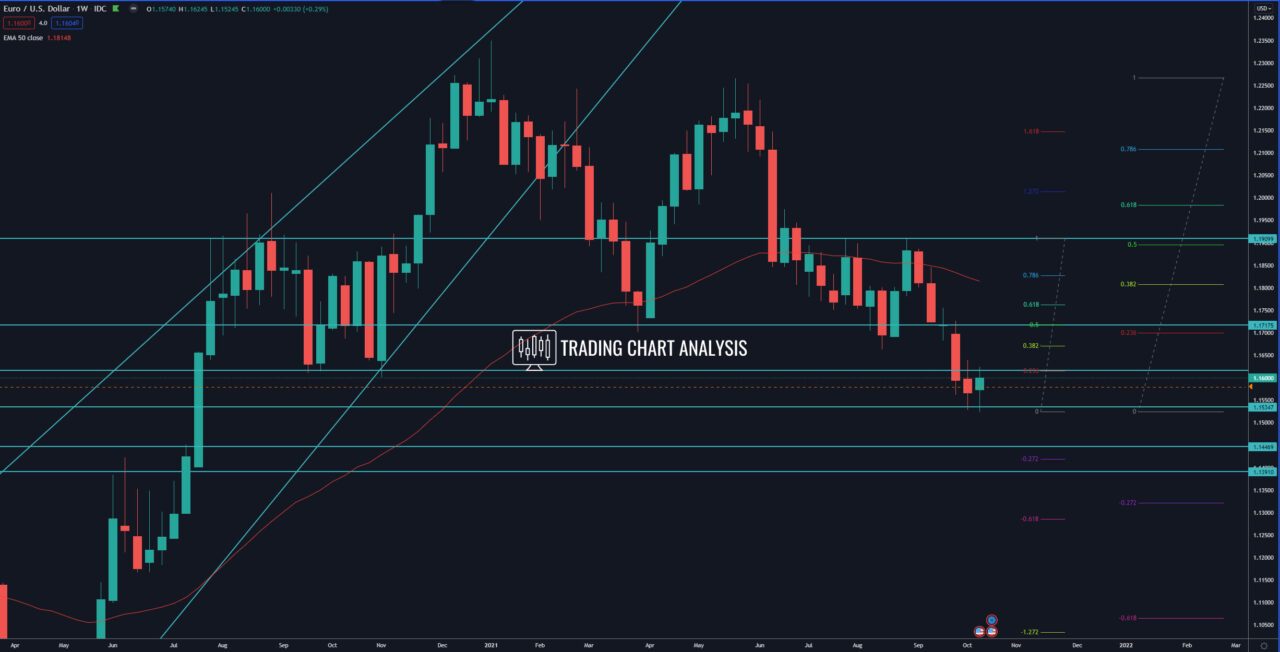
Technical analysis for the EUR/USD, the pair formed a tweezer bottom on the weekly chart, a signal for a potential pullback. The focus now is on the daily chart. The EUR/USD pair reached the 0.386 FIB retracement on the daily chart at 1.1615, and it was unable to close above it. That is not very encouraging for a potential further pullback. However, if the EUR/USD pair closed above the 0.386 FIB retracement at 1.1615, it will be a signal for further upside. The target of this upside potential is the 0.618 FIB retracement at 1.1670, where we have both dynamic and horizontal resistance. If the EUR/USD breaks above the 0.618 FIB retracement at 1.1670 on the daily chart, it will face strong resistance around 1.1700 – 1.1710 and descending trend line part of the descending price channel on the daily chart. Furthermore, a break above the descending price channel will have strong bullish implications and may send the price higher toward the high at 1.1909.
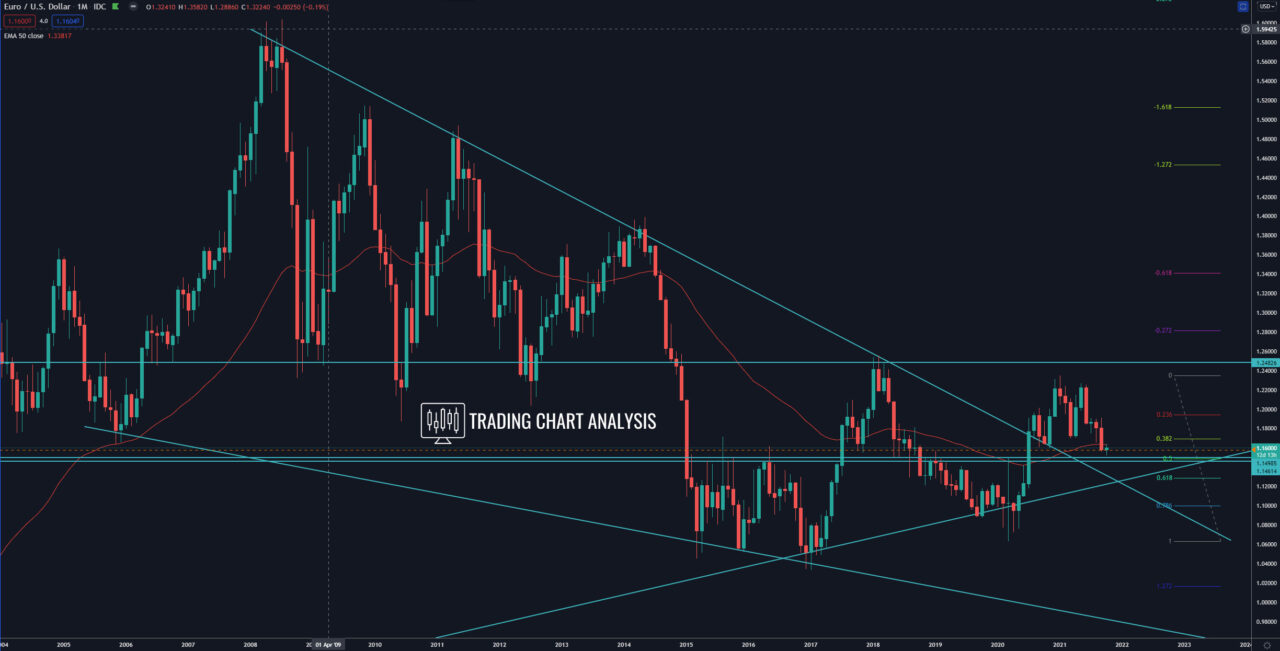
Looking at the bigger picture, looking at the monthly chart, the EUR/USD pair closed below the 0.386 FIB retracement and the previous low at 1.1602. That opened the door for a bearish run toward the 0.618 FIB retracement at 1.1285-90 on the monthly chart. Also, on the weekly chart and the daily chart, the EUR/USD pair hasn’t completed the bearish wave. The targets for this bearish wave are the 1.272 FIB extension at 1.1445-50 and the 1.618 FIB extension at 1.1285-90. Therefore, further declines for the EUR/USD are in favor, and a break below the last week’s low at 1.1524 will send the pair lower toward 1.1450.
Daily chart:

Weekly chart:

Monthly chart:


