|
Getting your Trinity Audio player ready...
|
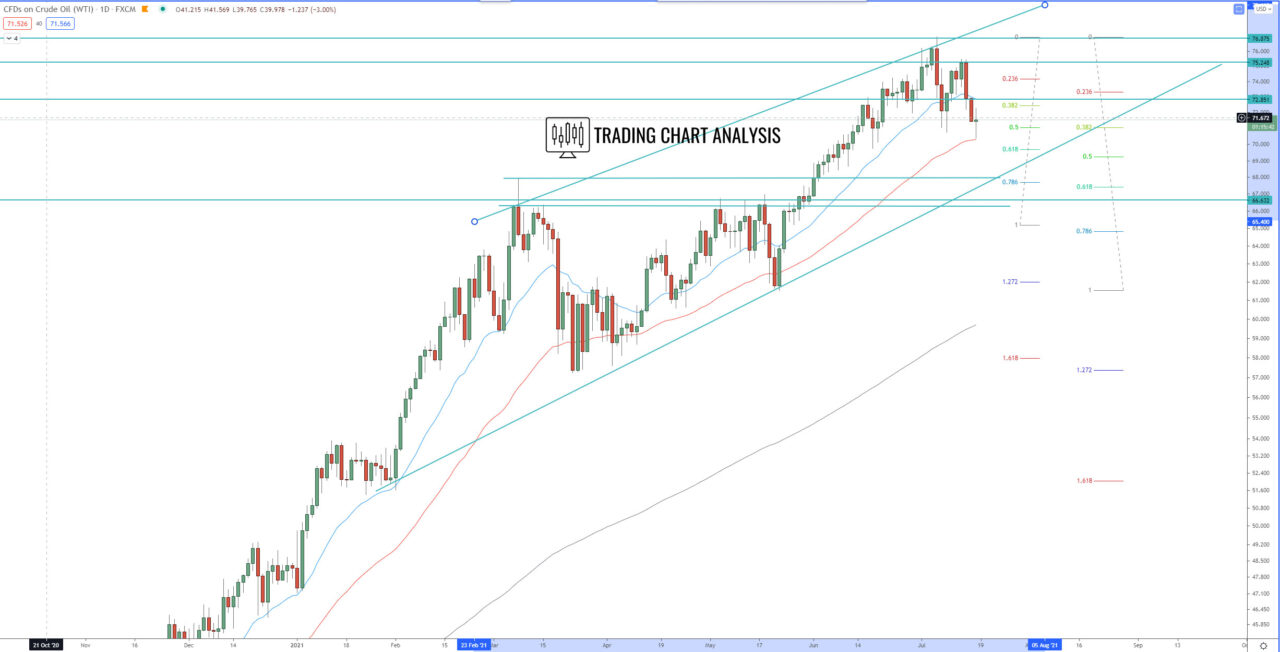
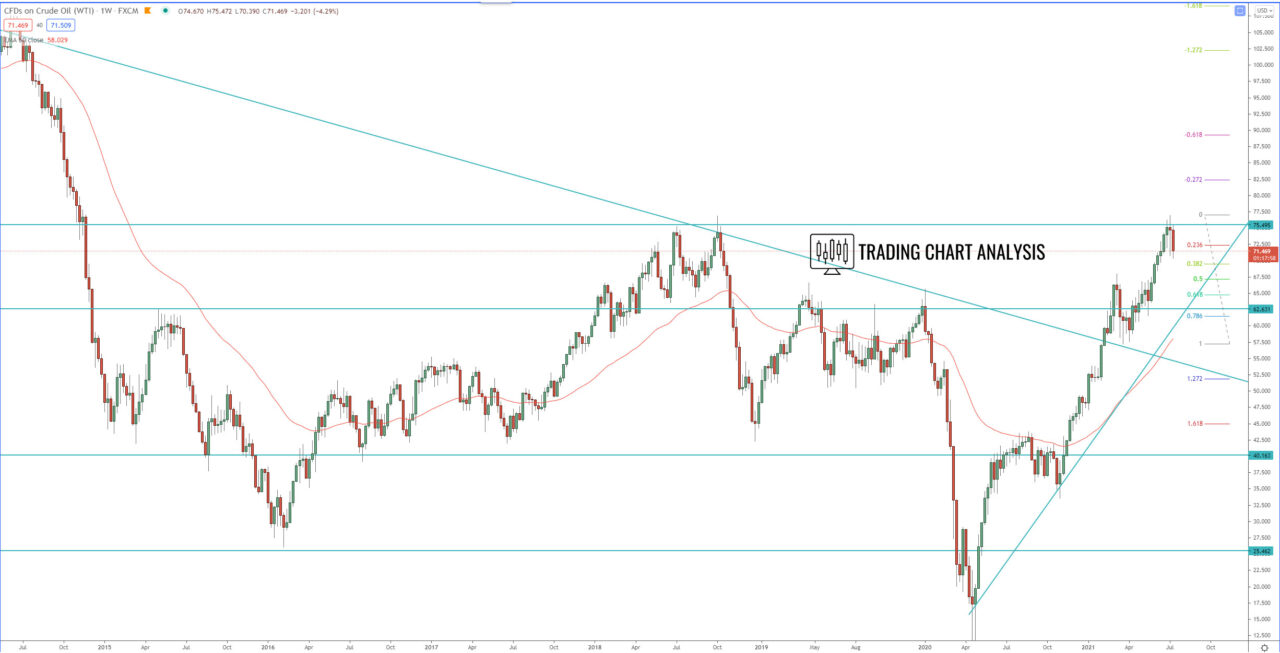
Technical analysis for US Oil, the price reached the first target of the bullish weekly wave at 1.272 FIB extension at 76.10, the price reach as high as 76.95 and started a retracement. The first target for the retracement is the 0.386 FIB retracement of the weekly chart at 69.50. If the price of crude oil breaks below 69.50, it will open the door for a run toward the 0.618 FIB retracement of the daily chart and 1.272 FIB extension of the bearish run on the 4H chart at 67.60.
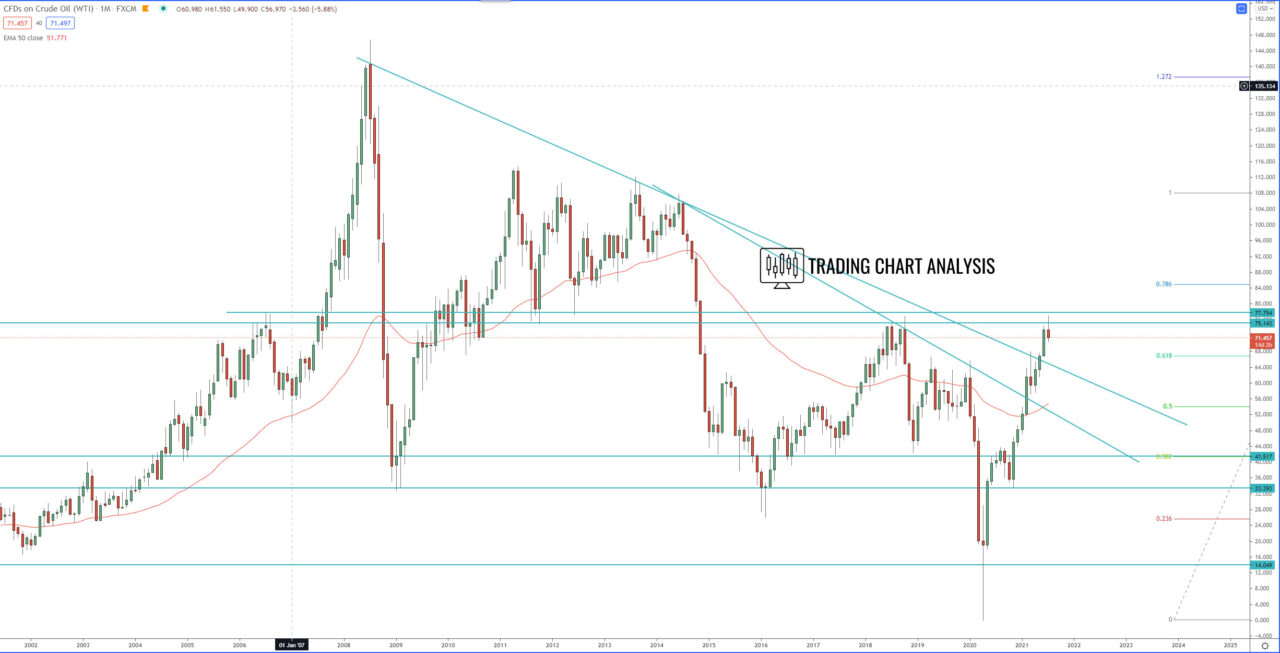
On the bullish side, if the price break above 75.70, it will be a signal for a bullish run toward the previous high at 76.95. If the Brent crude oil break above 76.95, it will resume the weekly bullish trend and send the price higher toward the 1.618 FIB extension at 87.70.
Daily chart:

Weekly chart:

Monthly chart:


