|
Getting your Trinity Audio player ready...
|
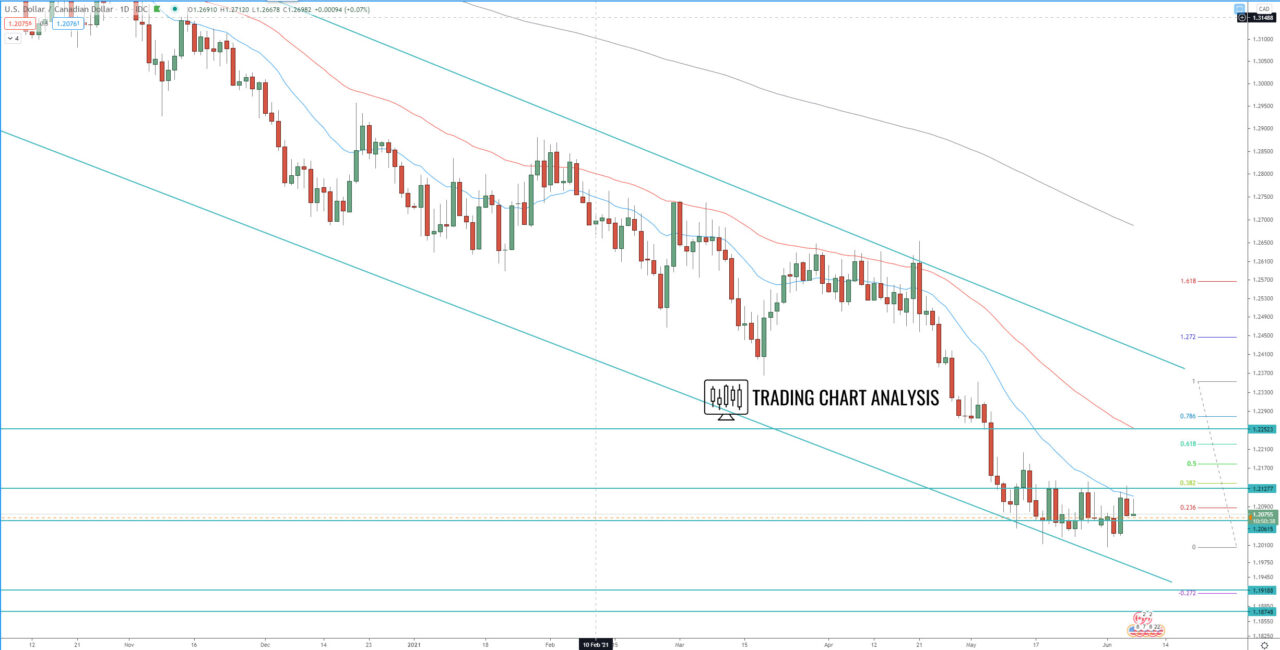
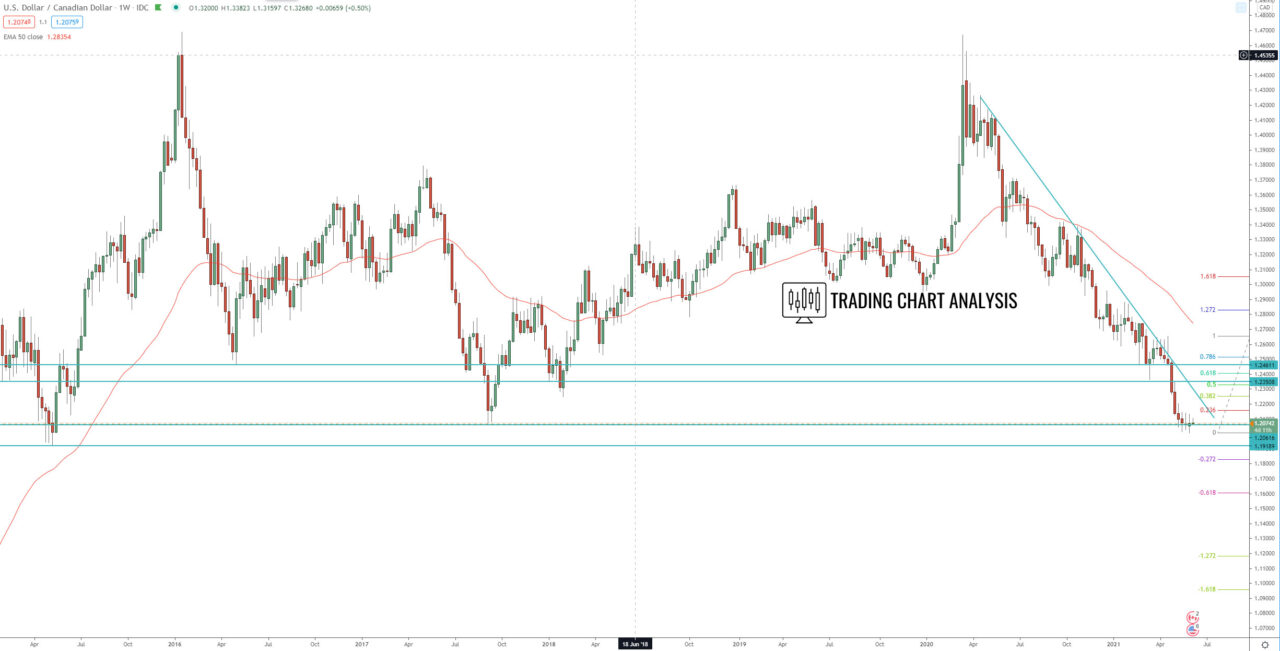
Technical analysis for the USD/CAD, the pair reached the first target of the third weekly bearish wave at 1.272 FIB extension at 1.2000 and started decelerating on the weekly chart. This decelerating on the weekly chart is a consolidation on the daily chart. The USD/CAD is holding above 1.2000 and formed a double bottom on the daily chart, an early signal for a potential pullback in the price. If the USD/CAD break above the current range, above 1.2140, it will send the price toward the 0.386 FIB retracement at 1.2255.
On the other hand, if the USD/CAD pair breaks below 1.2000, it will be a signal for a further decline ahead, toward first the support at 1.1919. And eventually toward the second target of the third weekly bearish wave at 1.618 FIB extension around 1.1550.
Daily chart:

Weekly chart:


