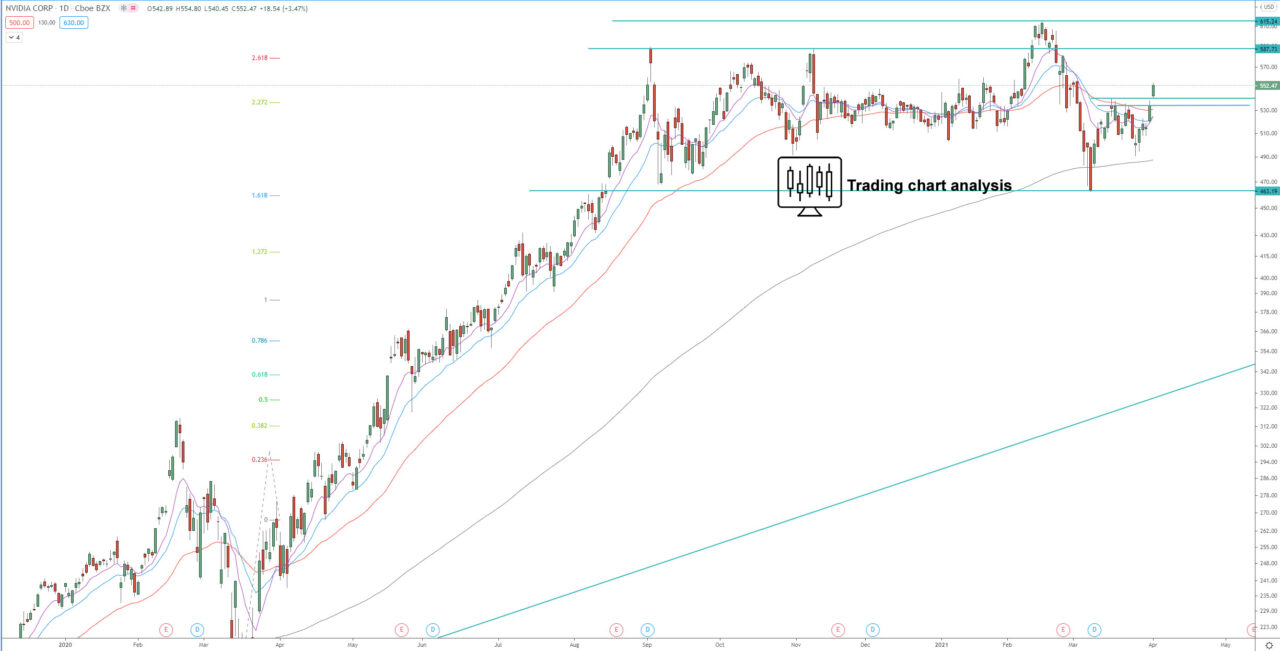
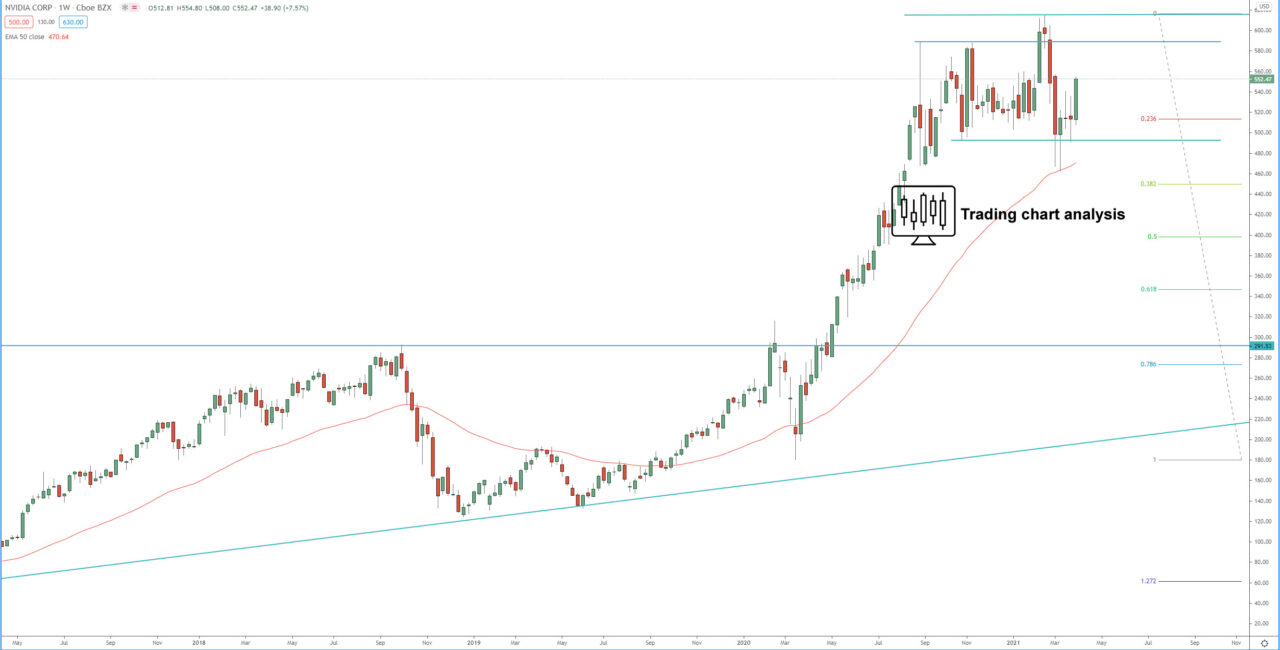
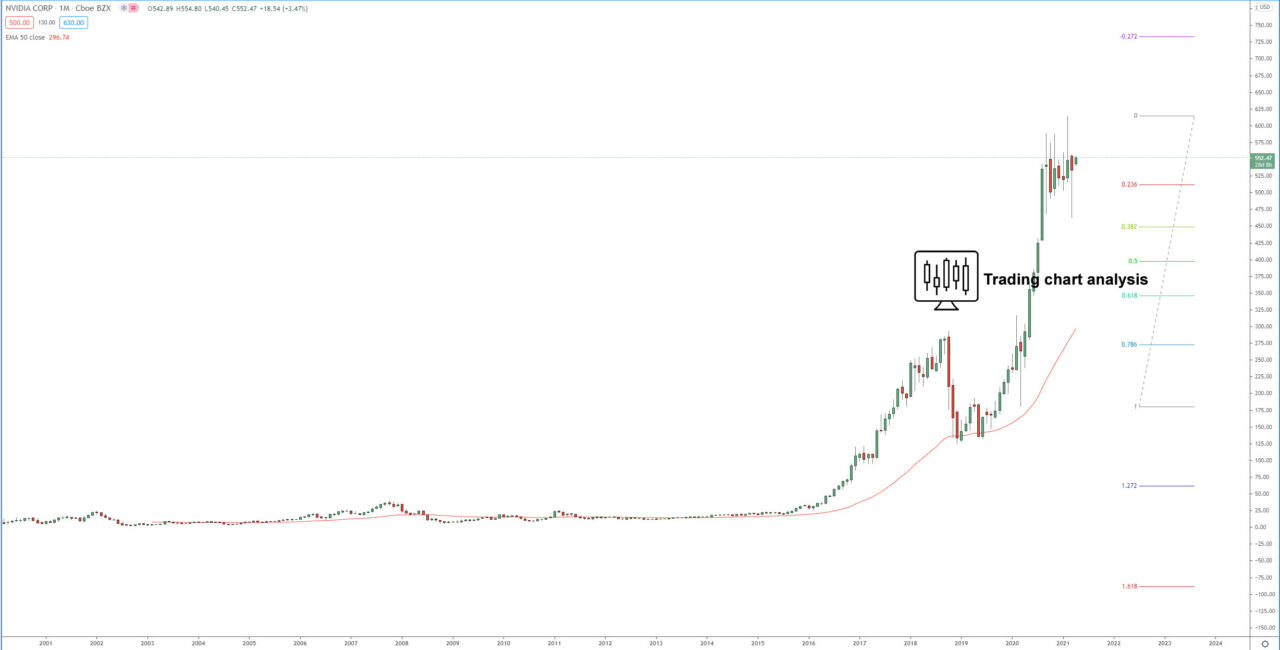
Technical analysis for NVIDIA CORP. (NVDA) is showing that the price reached the 5th target of the 3rd bullish monthly wave at 4.236 FIB extension around 580 and started a consolidation. After 6 months of consolidation, the shares of NVIDIA CORP. (NVDA) broke above resistance on the daily chart, which is an early signal for resumption of the bullish trend. The first target of this break is at 1.272 FIB extension at 590$, the second target is at 1.618 FIB extension at 617. If the shares of NVIDIA CORP. (NVDA) break above 615$ – 617$ that will be a signal for resumption of the weekly bullish trend, and it will send the price toward 2.618 FIB extension at 680$.
On the other hand, if the shares of NVIDIA CORP. (NVDA) breaks below 490$, it will resume the daily bearish run and send the price toward the previous daily low at 462$. If the price break below 462$ and the consolidation range, it will accelerate the decline and send the price toward 400$.
Daily chart:

Weekly chart:

Monthly chart:


