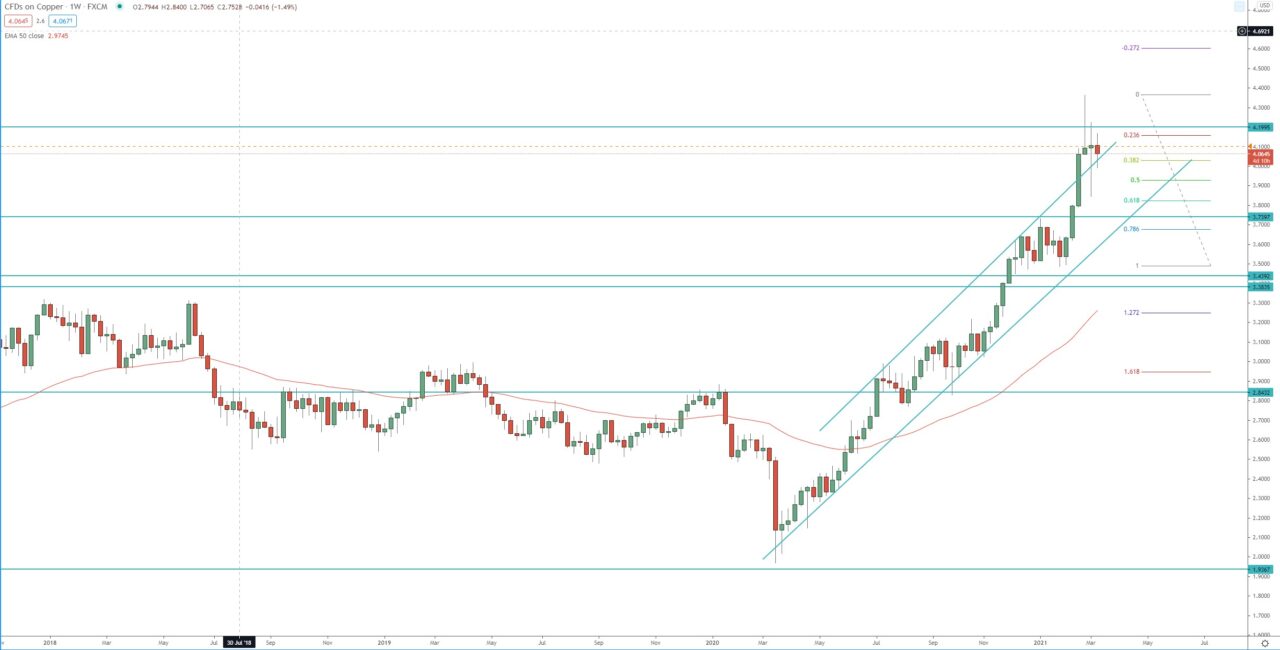
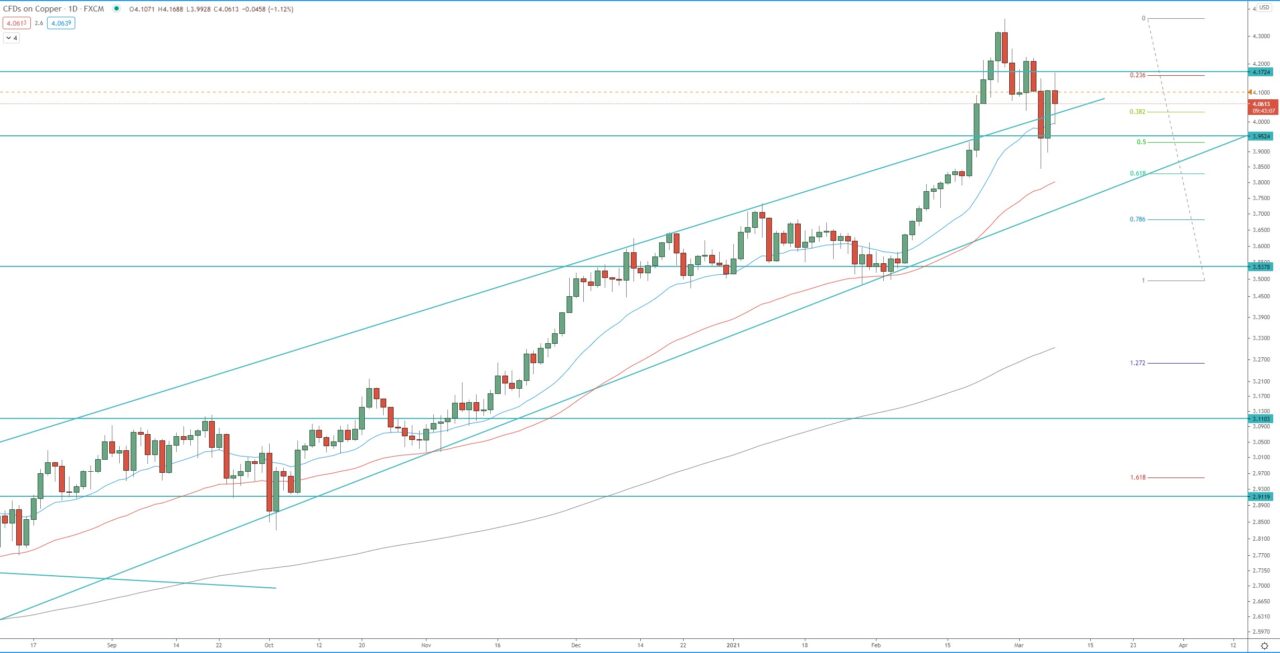
The price formed tweezer tops on the weekly chart, signaling a potential pullback. This pullback is shaping as an ABC pullback on the daily chart. If the price breaks below the previous week’s low, it will extend the decline toward, first at 1.272 FIB extension around 3.81 if we see a break below that further decline is favorable toward 1.618 FIB extension around 3.700!
On the other hand, if the price break above 4.17, it will be a signal for resumption of the bullish trend and send the price back toward, first 4.22, and second 4.36.
Weekly chart:

Daily chart:


