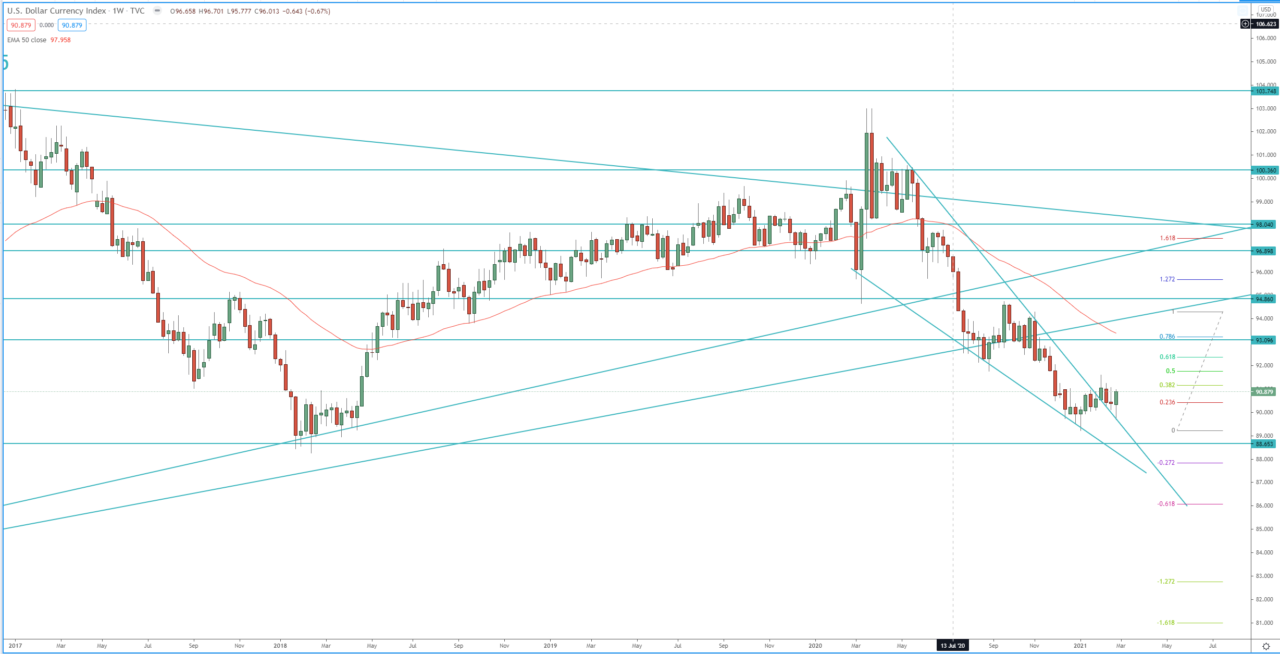
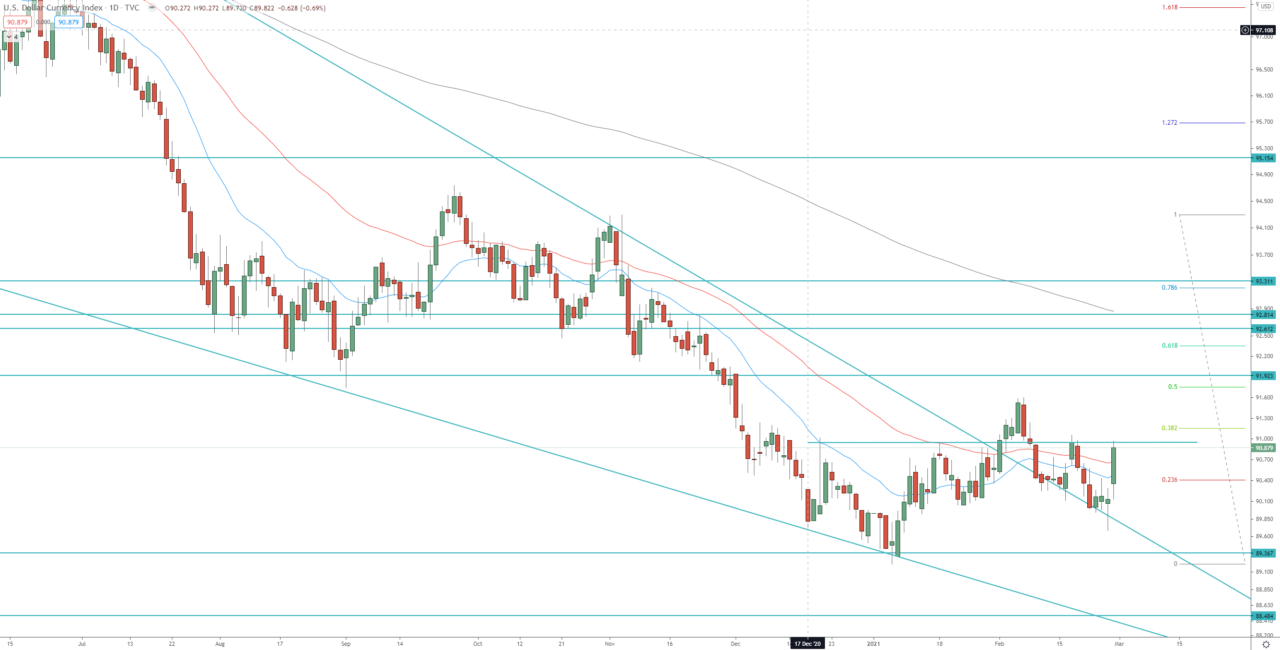
The index closed the week with a bullish low-test candle rejecting the breakout of a descending wedge on the weekly chart. The rejection on the weekly chart materialized on the daily chart as a low-test candle and evening star pattern rejecting the breakout of the descending wedge. However, despite these bullish signals, the daily chart formed a Head & Shoulders pattern, which we must monitor closely. Therefore, breaks above 91.06 will invalidate the Head & Shoulder pattern and send the price toward, first the previous high at 91.60, second toward the resistance between 92.60 – 92.80.
On the other hand, if the index breaks below the neckline, it will resume the daily bearish trend and send the price toward, first previous low at 89.20, second toward the 1.272 FIB extension on the 3rd bearish weekly wave around 88.50.
Weekly chart:

Daily chart:


