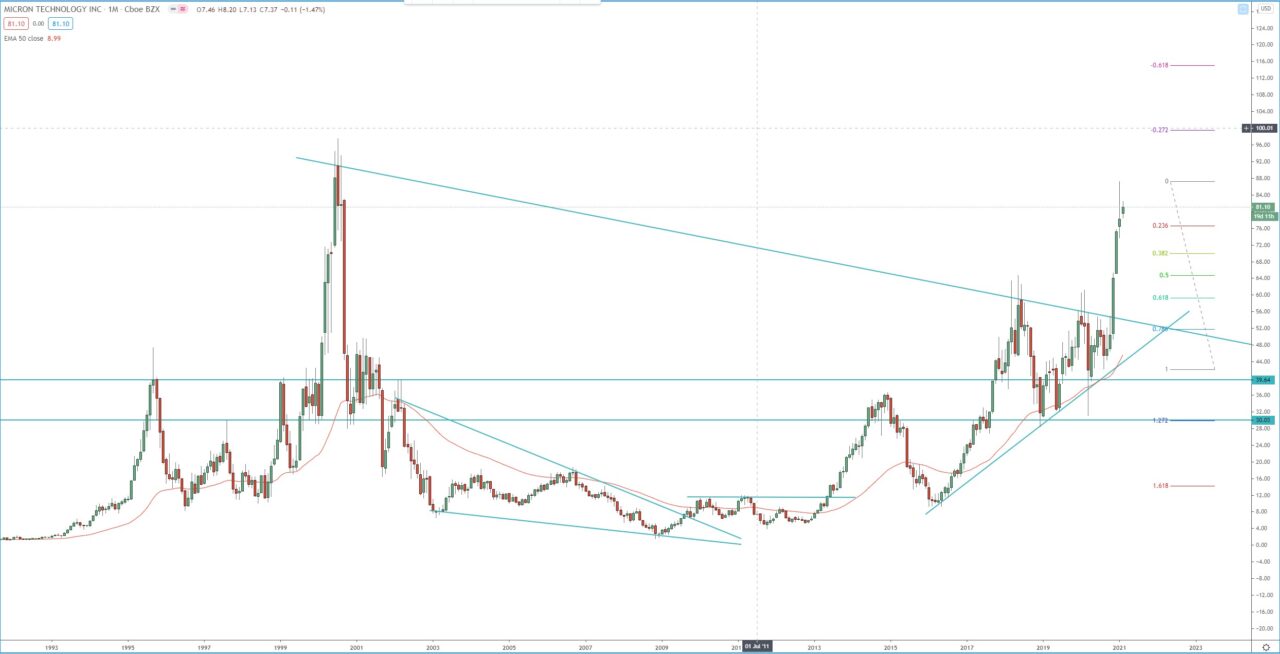
Looking at the monthly chart we can see that the break out that materialize in 2013 was confirmed and extended with another break out higher in September 2017.
The monthly chart is within its 3rd bullish wave and reached and exceed the first target for that wave at 1.618 FIB extension around 65.00$. Next target for the 3rd bullish monthly wave is at 2.272 FIB extension around 88.00$ – 90.00$. If we see break above that next target of the bulls will the previous all-time high at 97.50$ and 2.618 FIB extension around 100.00$.
In case of a pullback, the 0.618 FIB retracement and support around 60.00 and above that at 65.00$ may provide support, rejection and resumption of the bullish monthly trend. We also have 0.386 FIB retracement and previous daily low between 69.00 – 70.00$ and may provide support in case of a pullback.
Monthly chart:


