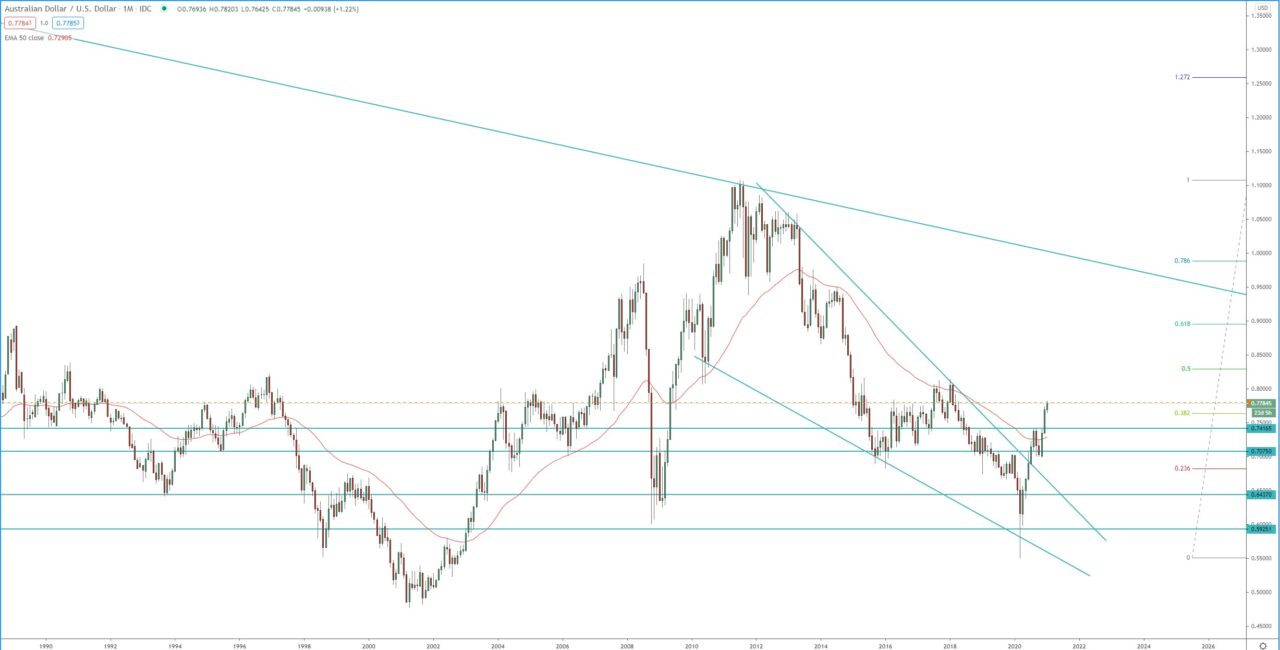
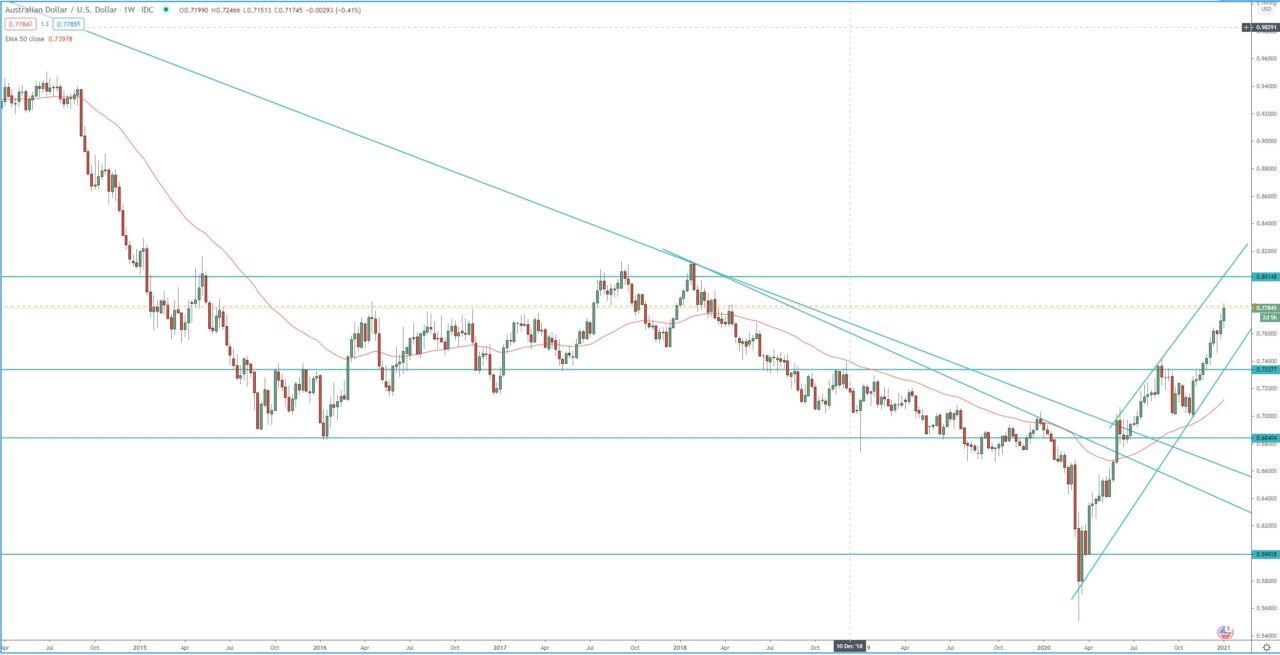
The price broke briefly below the 2008 low in the beginning of the COV19 pandemic, but held that support on the monthly chart. Eventually we saw break above key horizontal and dynamic resistance above 0.7000.
Now the price is within 3rd bullish wave on both the monthly and weekly chart. The second target of that bullish weekly wave is at 1.618 FIB around 0.8080.
The first target of the monthly bullish wave is at 1.272 FIB around 0.9420, however we need to see break above 0.8080 to confirm that. Support level to watch for rejection and resumption of the bullish trend in case of pullback are, the support around 0.7400, or if we get deeper pullback around 0.7070.
Monthly chart:

Weekly chart:


