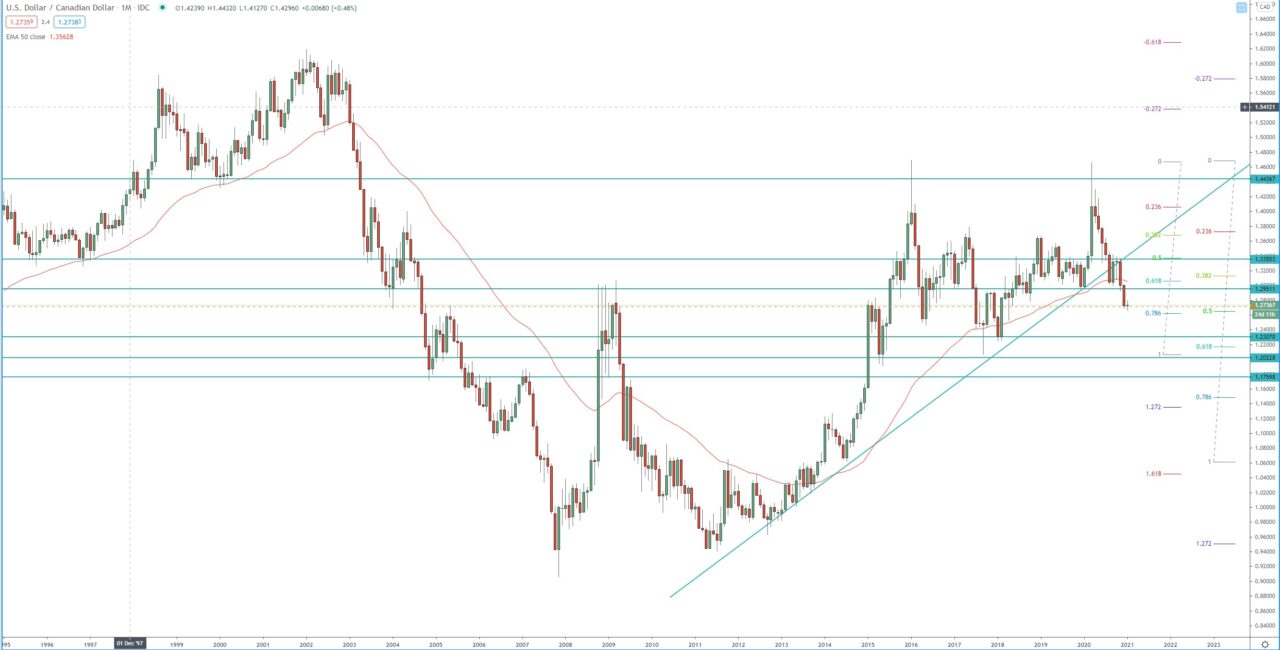
On the monthly chart we can see double tops rejecting key resistance zone around 1.4430 and since then the price broke below, first dynamic support and then strong horizontal support below 1.2950.
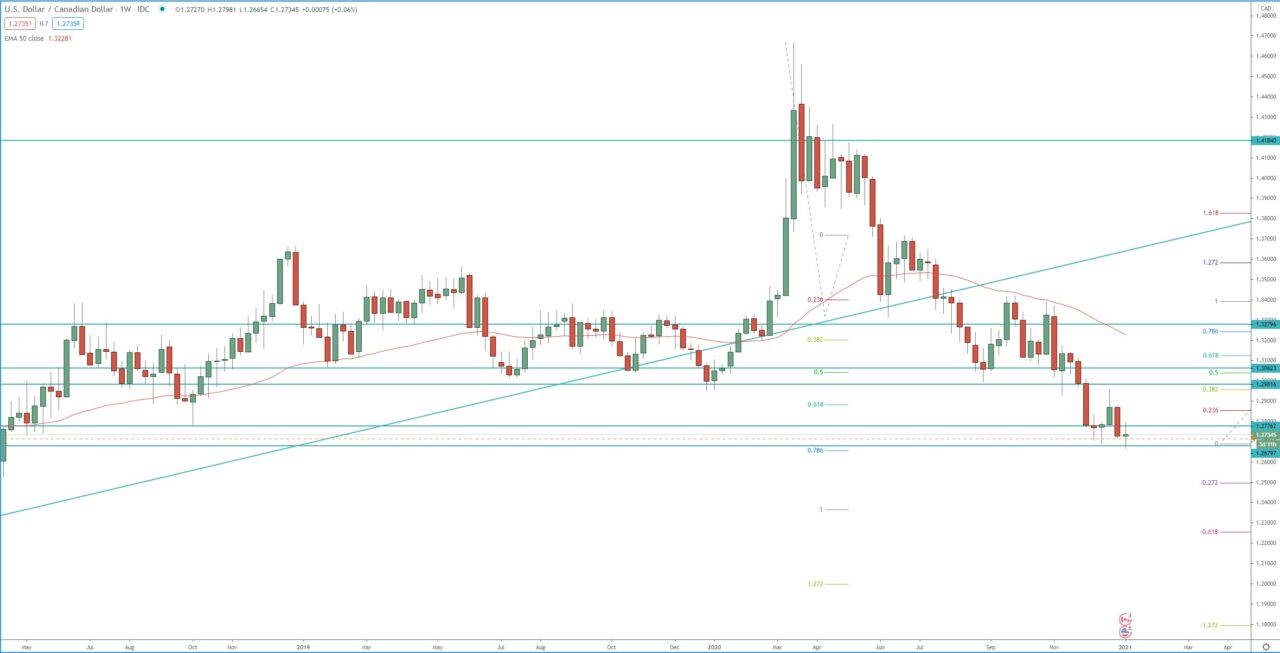
The price is within the 3rd bearish wave of the monthly and weekly bearish trend. The first target of that bearish weekly wave is at1.272 FIB around 1.2000.
In case of a pullback, we should watch the resistance zones between 1.2950 – 1.2975 and 1.3280 – 1.3320 for rejection and resumption of the bearish trend.
Monthly chart:

Weekly chart:


