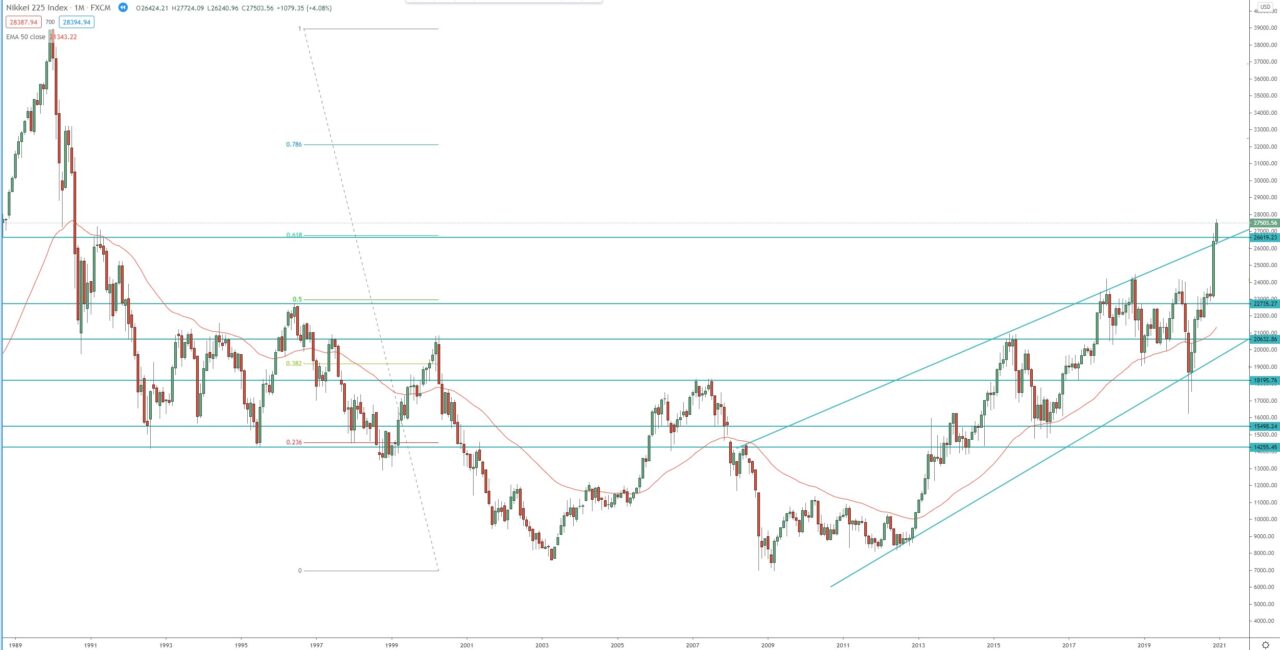
In the month of November 2020 the index broke above strong resistance that was holding the price since December 2017. The bullish momentum was strong enough to carry the index beyond levels last seen 30 years ago, in 1990!
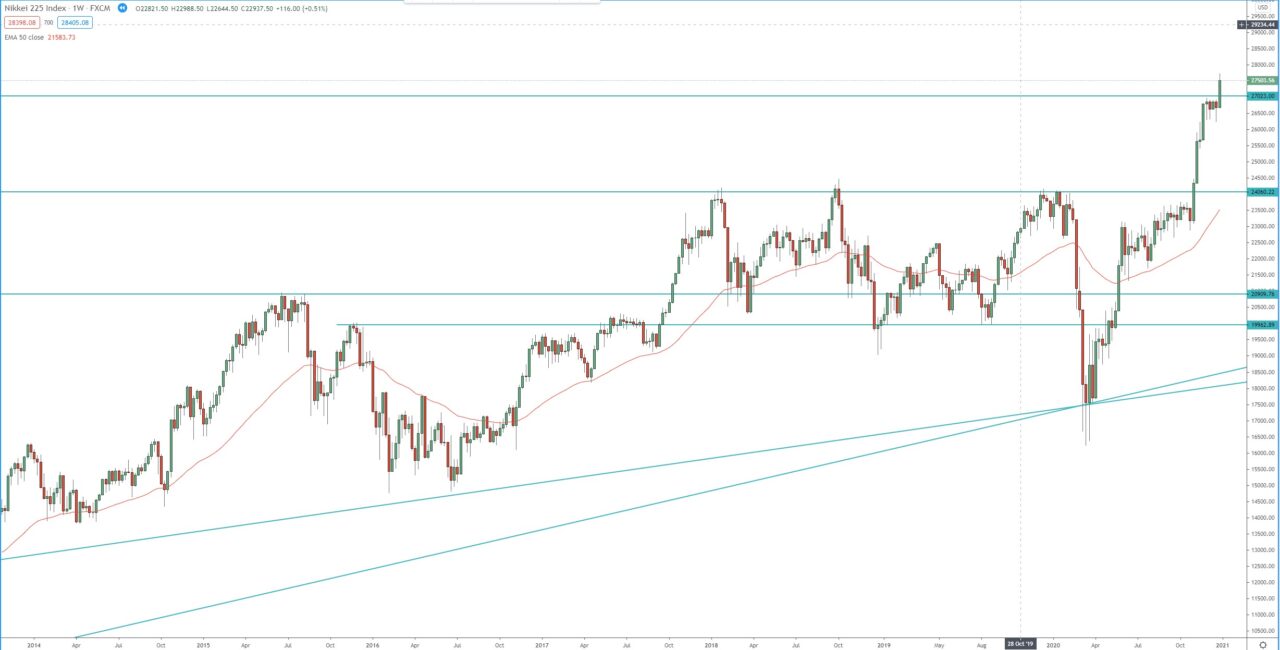
The weekly chart is within 3rd bullish wave, the first target of that wave is at 1.272 FIB extension around 30 080 – 30 200, second target is at 1.618 FIB extension around 32 500 – 33 000!
In case of a pullback, key level to watch for rejection and resumption of the bullish trend are, 27 000 – 26 500 and the previous strong resistance now support around 24 500 – 24 000!
Monthly chart:

Weekly chart:


