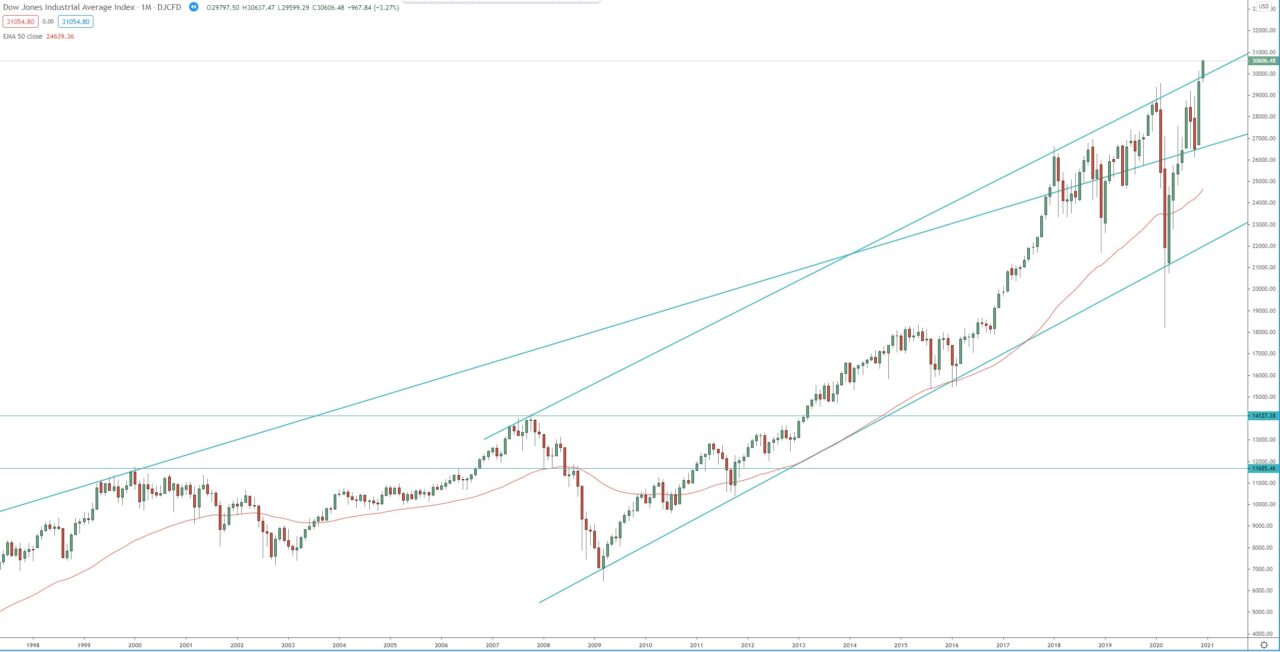
Looking at the monthly chart, we can see that the index not only broke above pre-pandemic high, but it also broke above this ascending price channel, signaling further upside.
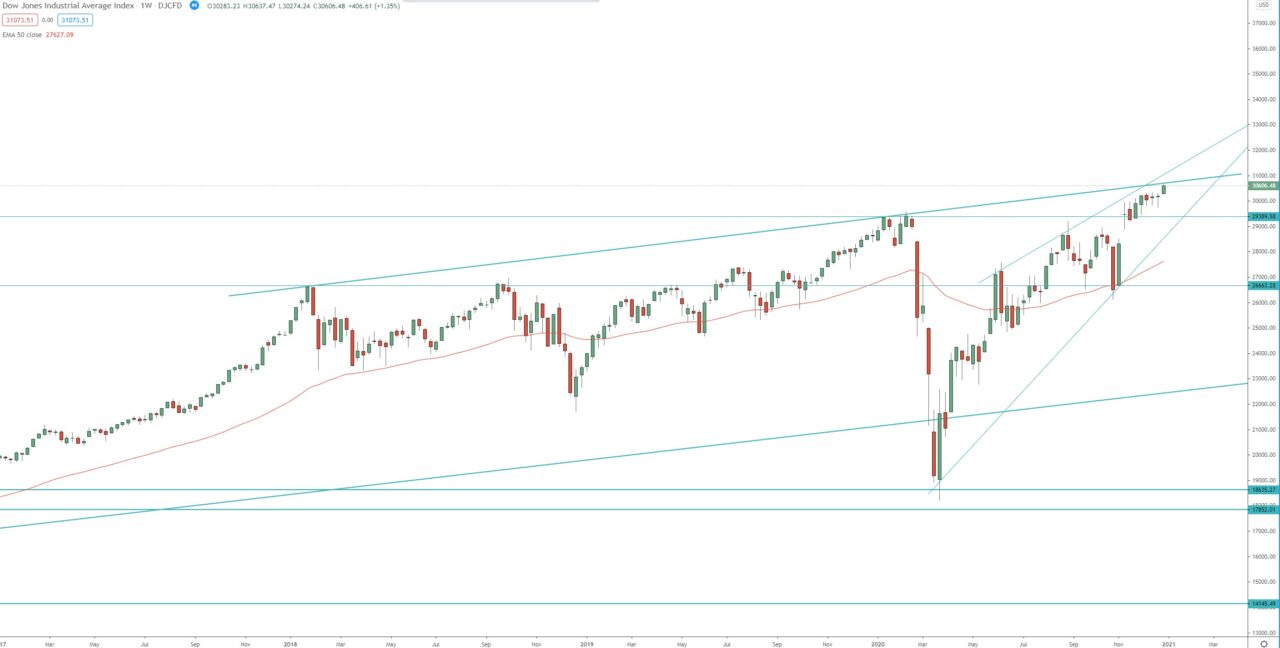
The weekly chart is in its 3rd bullish wave, the first target of that wave is at 1.272 FIB extension around 36 700, the second target is at 1.618 FIB extension around 40 000! We need to see break above the dynamic resistance to confirm further upside.
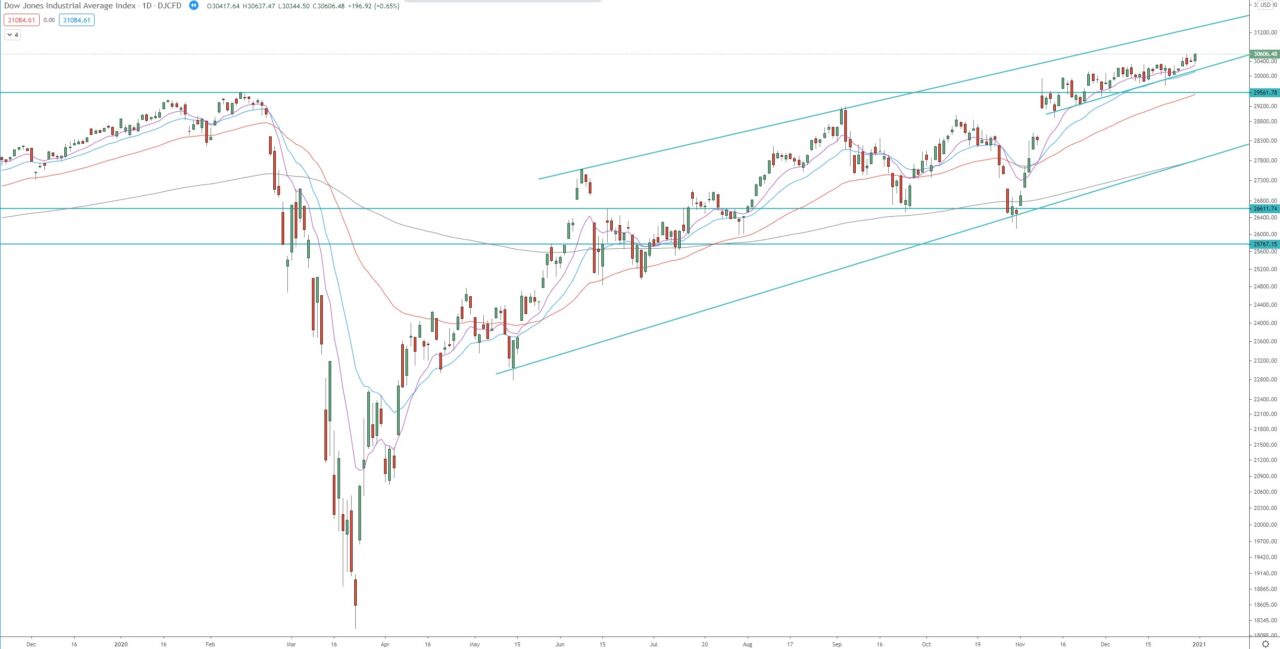
The daily chart is in its 3rd bullish wave as well, the first target of that wave is at 1.272 FIB extension around 31 100, the second is at 1.618 FIB extension around 33 370!
Monthly chart:

Weekly chart:

Daily chart:


