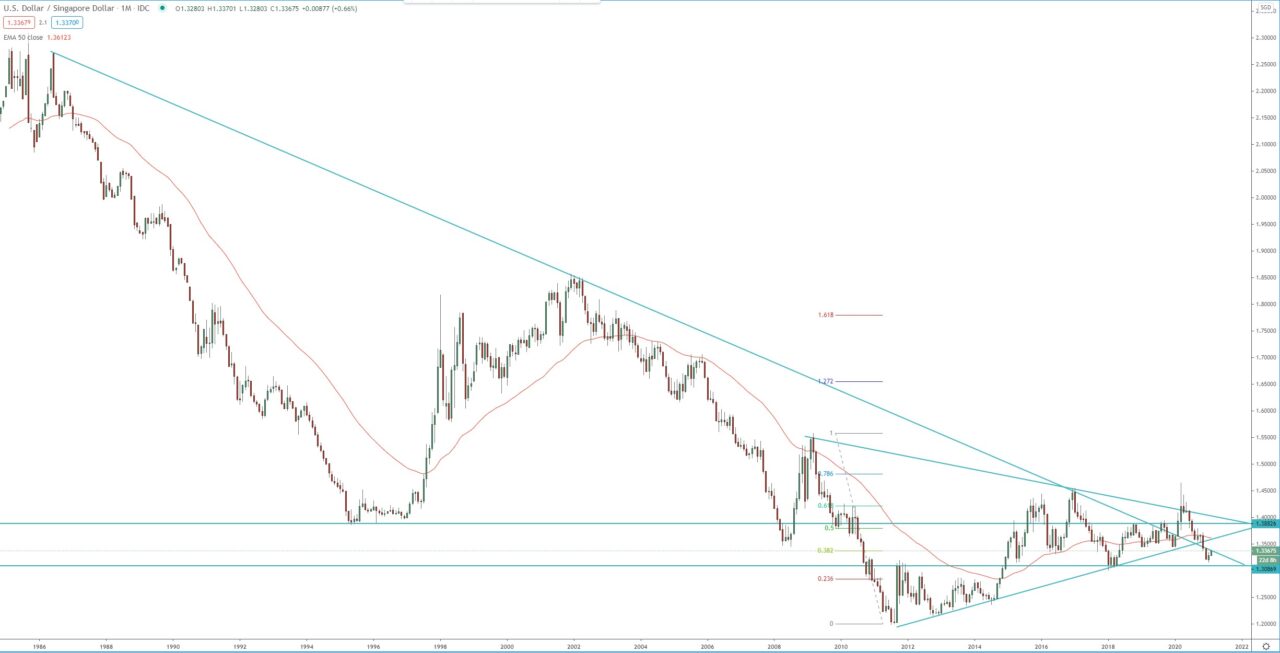
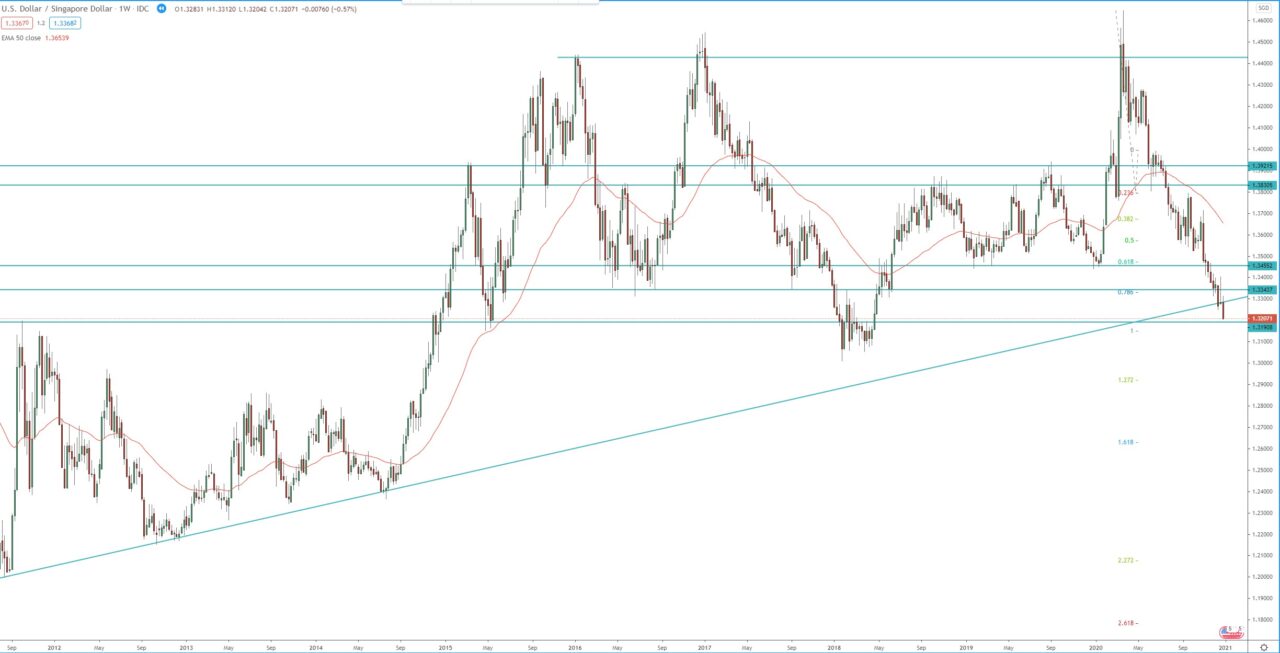
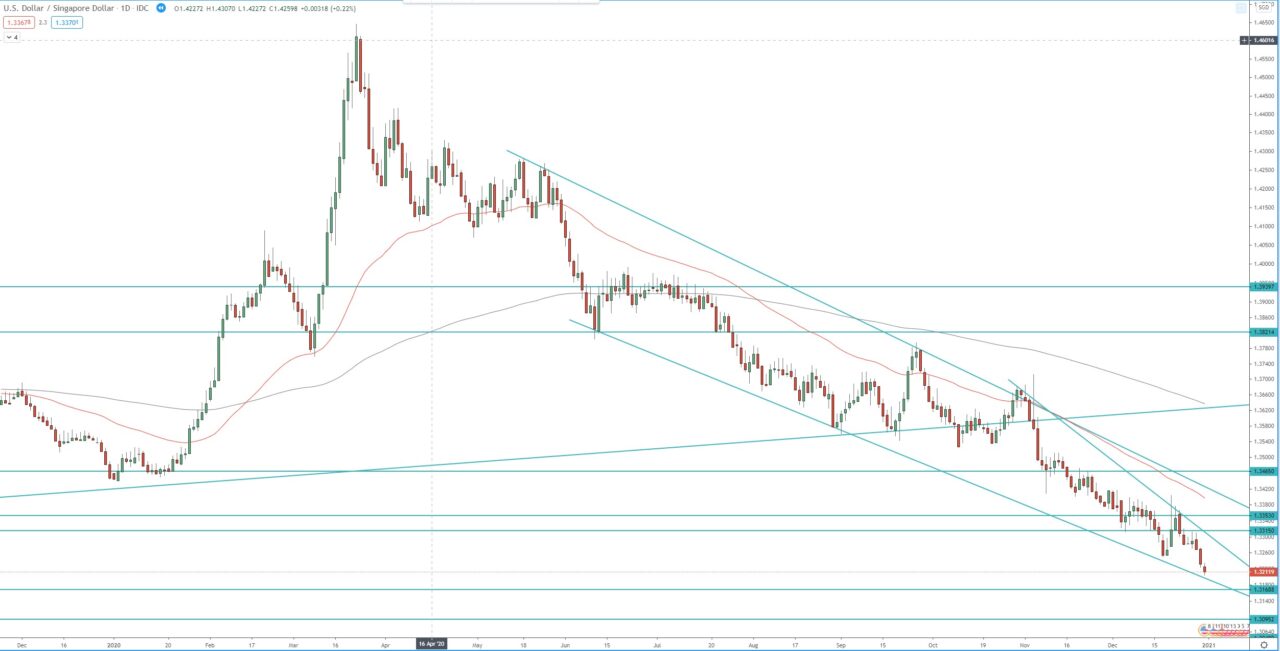
The pair failed to continue to the upside and to extend bullish break out on the monthly chart, that happened in December 2014. Instead during the COV19 pandemic the price retest an rejected the 2016, 2017 high around 1.4550, forming double tops, and eventually started a bearish trend on the daily chart and bearish run on the weekly. The bearish break down was strong enough to break below horizontal support around 1.3450 and dynamic support on the monthly, weekly and the daily charts.
The bearish trend on the weekly chart exceeded the 1.618 FIB extension around 1.3450 of the 3rd daily bearish wave and continue toward the 2.272 FIB extension around 1.3110.
Key support zone to watch is 1.3100 – 1.3000, break below that will be extend this bearish weekly trend toward, first 1.2900, second toward 1.2600 – 1.2400 zone.
To the upside break above this descending price channel on the daily chart may start a deeper pullback toward 1.3400 – 1.3500 resistance zone.
Monthly chart:

Weekly chart:

Daily chart:


