|
Getting your Trinity Audio player ready...
|
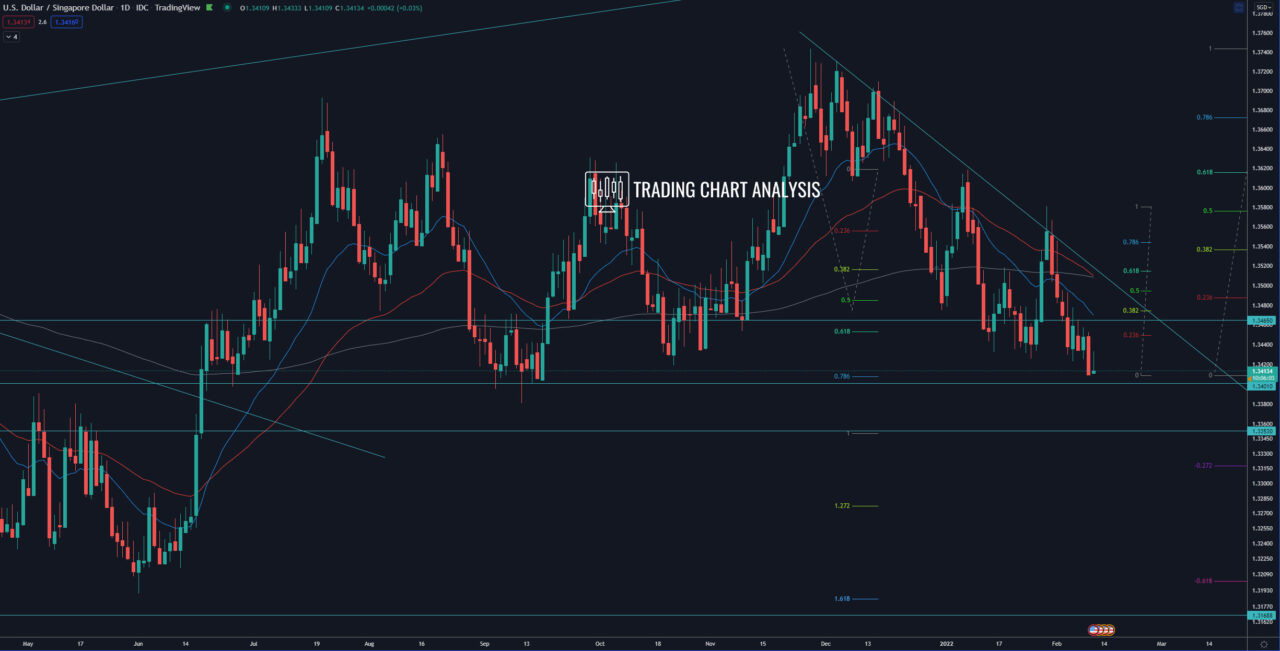
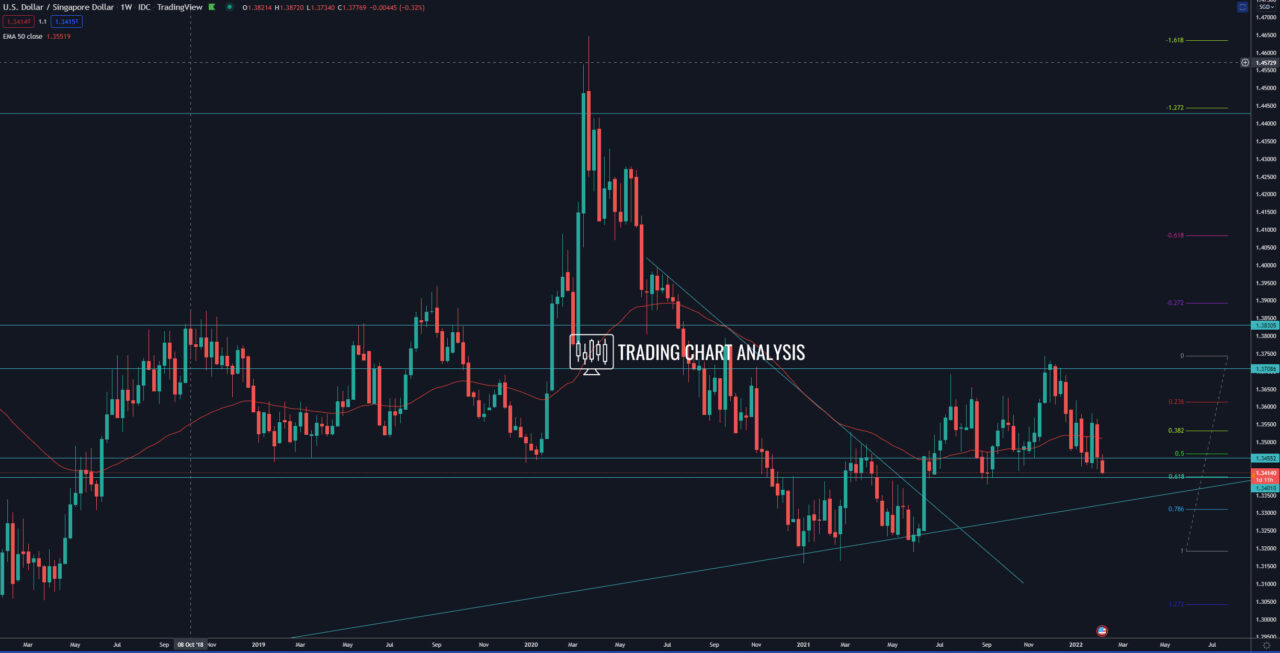
Technical analysis for USD/SGD, the pair is approaching a strong support zone between 1.3380-1.3400, where we have the 0.618 FIB retracement at 1.3400 and the weekly low at 1.3380. If the USD/SGD breaks below this support zone, that will send the pair lower. The first target for such a potential break is the support and 0.786 FIB retracement on the weekly chart at 1.3310. The second target is the 1.272 FIB extension on the daily chart at 1.3275. The third target is the 1.618 FIB extension on the daily chart at 1.3180, which is within a support zone.
On the other hand, if the USD/SGD manages to hold and trade above the 0.618 FIB retracement at 1.3400, that will place the focus back on the previous daily high and resistance at 1.3581.
Daily chart:

Weekly chart:

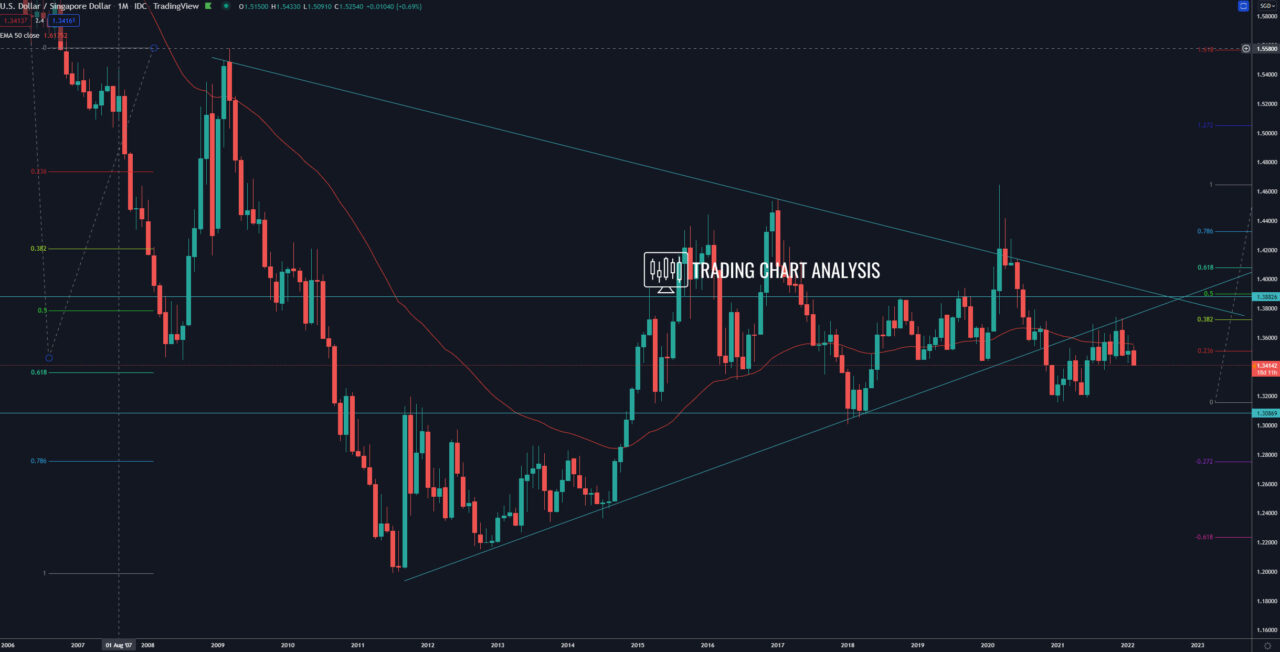
Monthly chart:


