|
Getting your Trinity Audio player ready...
|
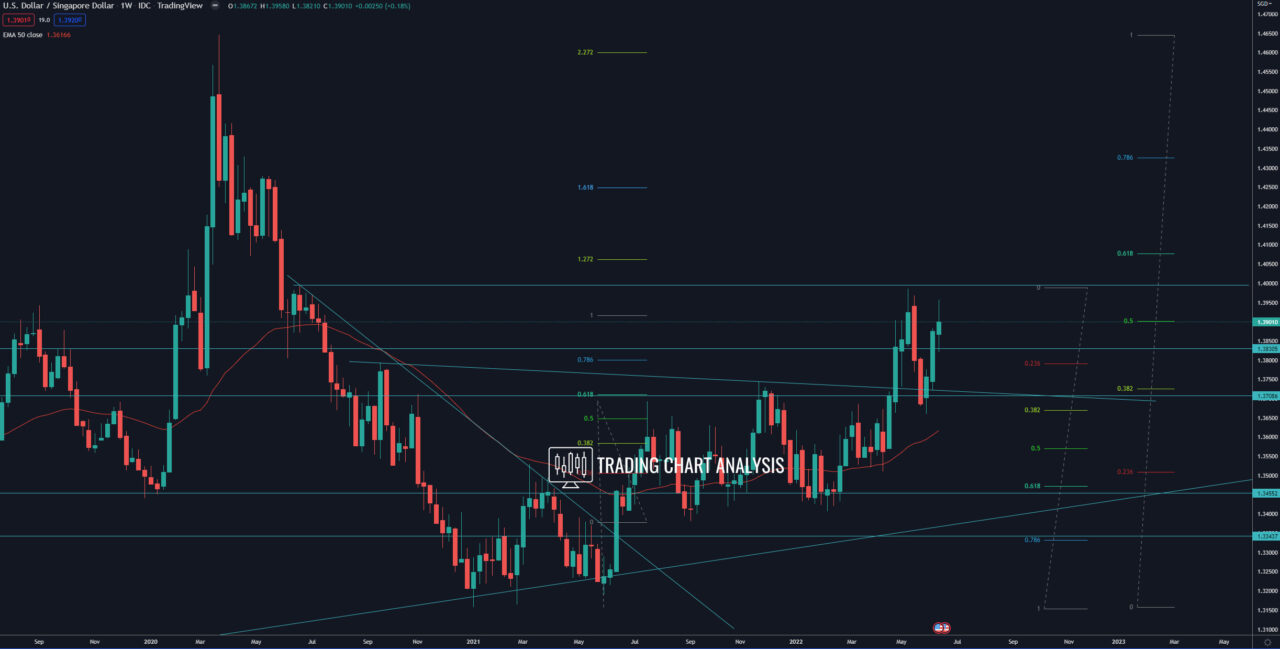
Technical analysis for USD/SGD, the pair broke out in April, closing above the 0.382 FIB retracement on the weekly chart and continued the bullish wave on the weekly chart. The first target for the bullish wave in USD/SGD is the 1.272 FIB extension on the weekly chart at 1.4050, where we have the 0.618 FIB retracement. The second target is the 1.618 FIB extension on the weekly chart at 1.4250. The third target for the USD/SGD bulls is the 2.272 FIB extension on the weekly chart at 1.4600.
On the other hand, if the USD/SGD breaks below the 0.382 FIB retracement on the weekly chart and the previous low at 1.3660, that will open the door for a bearish run toward the 0.618 FIB retracement on the weekly chart at 1.6470.
Weekly chart:


