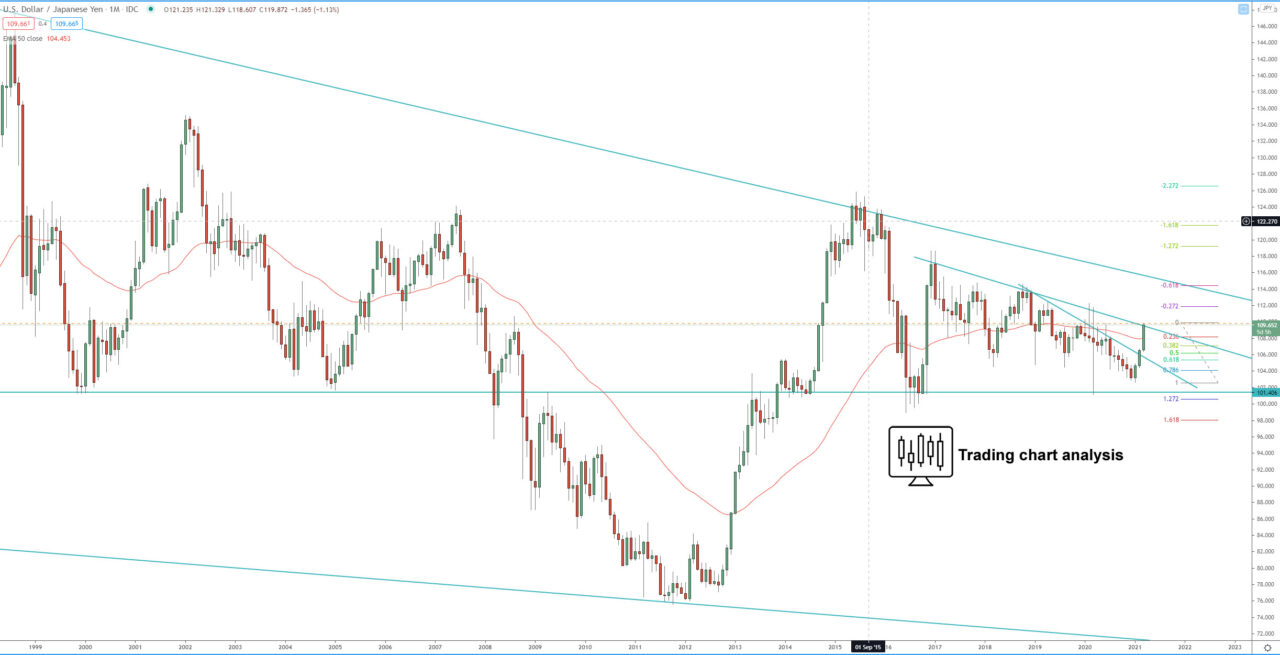
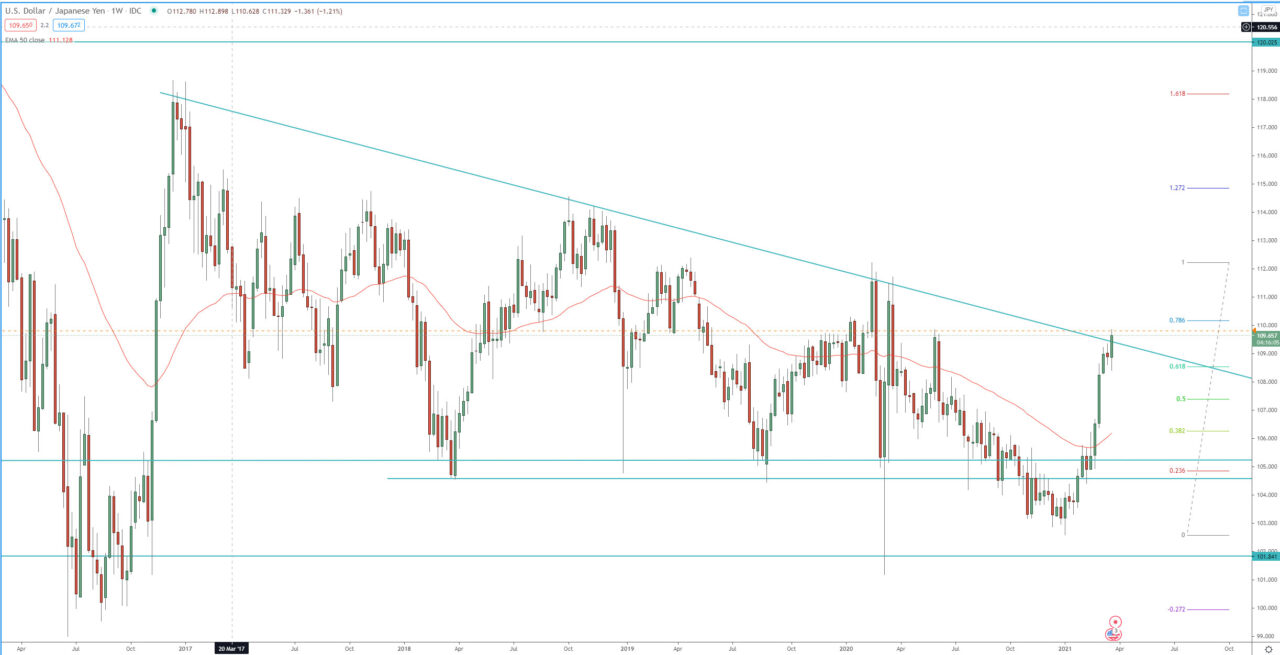
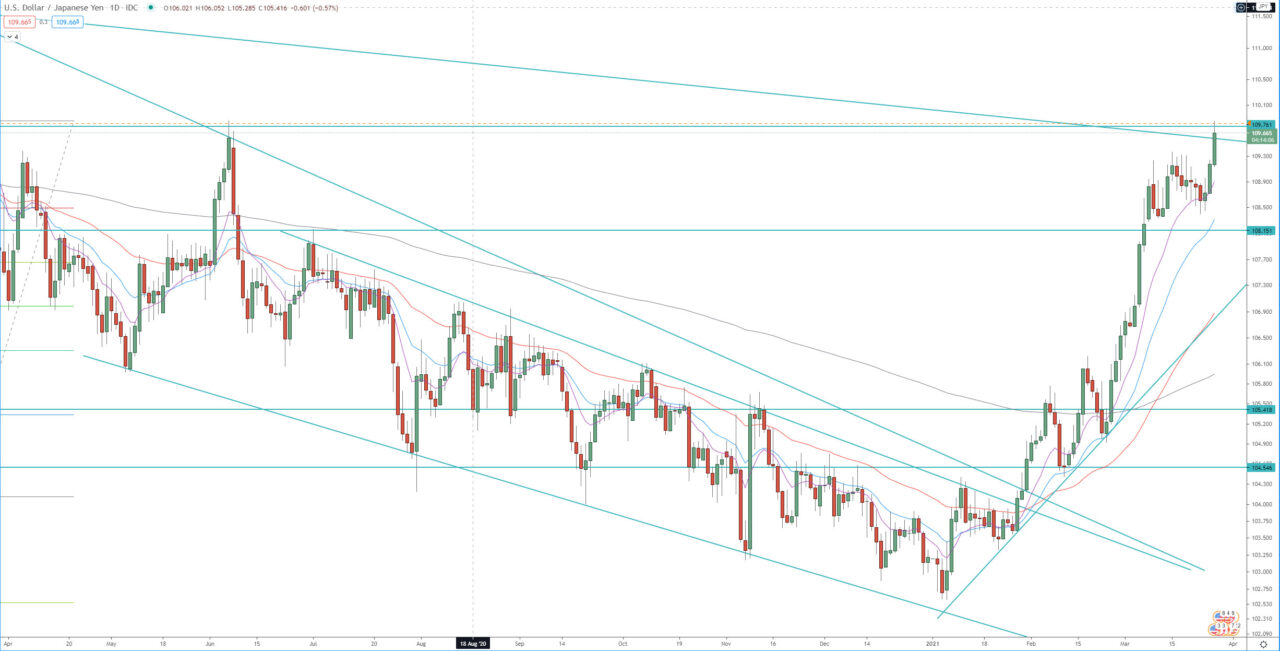
Technical analysis for the USD/JPY is showing that the pair reached the second target of the daily bullish wave at 1.618 FIB extension at 109.55 and touched the key resistance level at 109.85. Break above 109.85 will be a break above dynamic resistance, descending trend line and will send the price toward next resistance level between 111.50 – 111.70.
Rejection of 109.85 may lead to consolidation or a pullback in the USD/JPY pair, further price action is required to determine which is going to be.
Monthly chart:

Weekly chart:

Daily chart:


