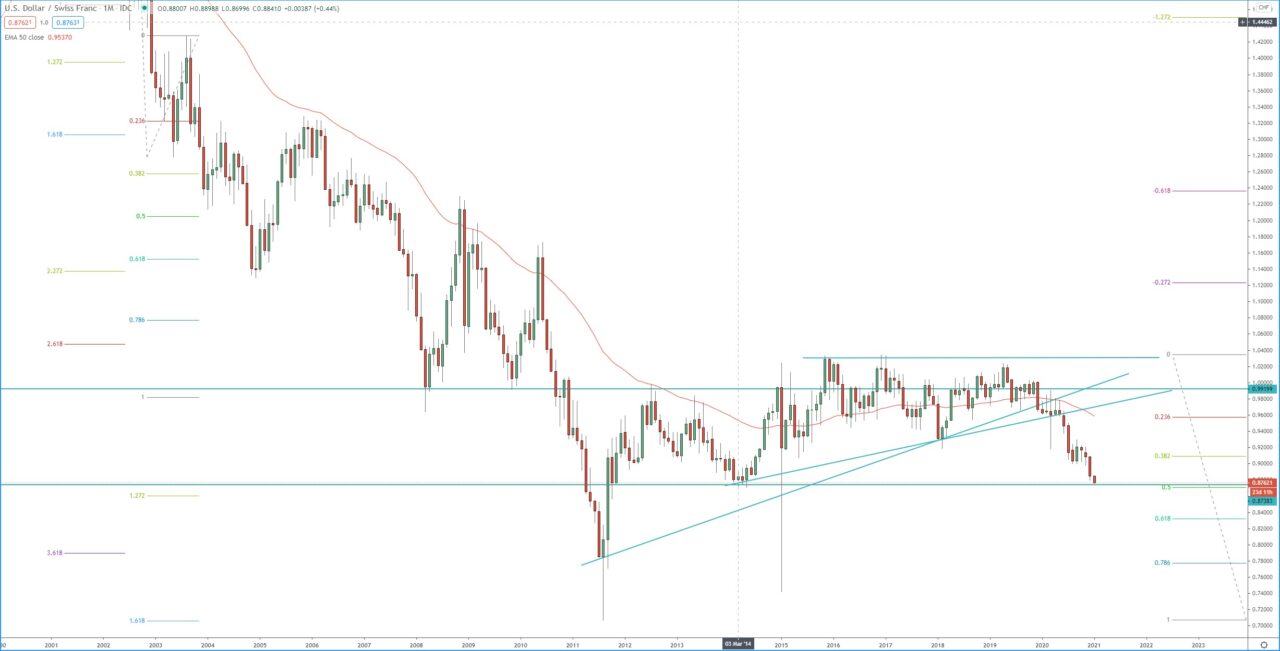
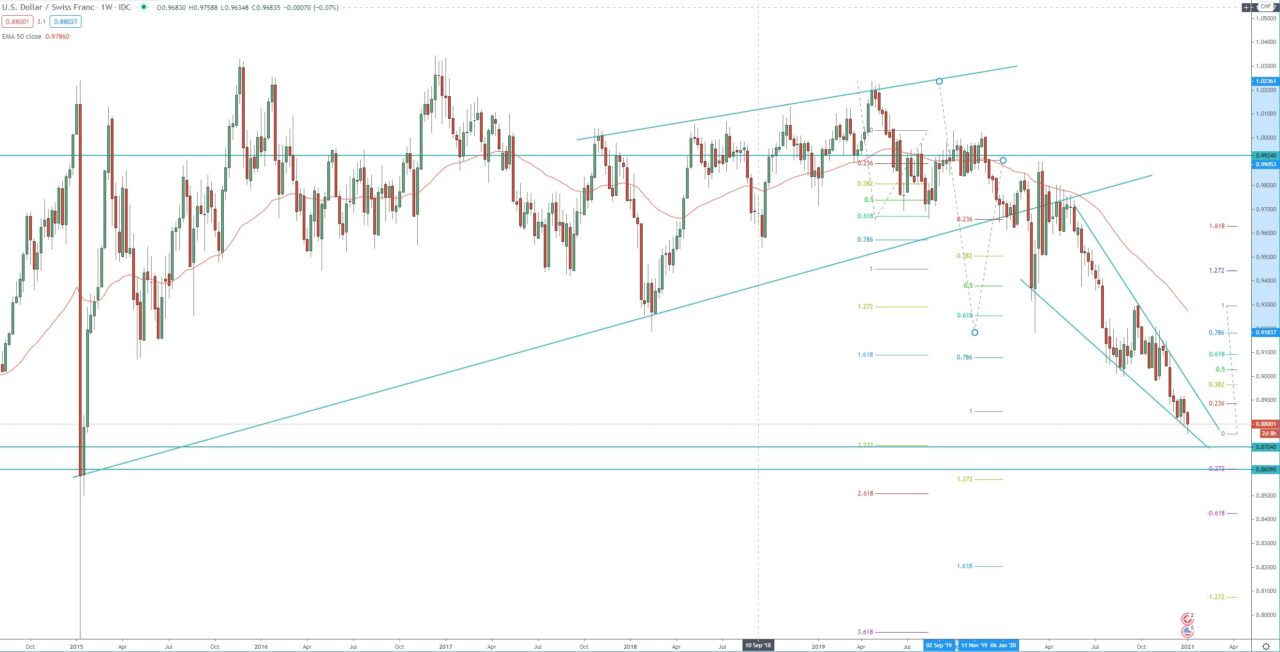
Bearish monthly, weekly and daily chart. The first target for this bearish monthly run is the 1.272 FIB around 0.8550, but before that we have some support around 0.8700. This support zone between 0.8500 – 0.8700, should provide bounce and eventually may lead to bullish run. If the price break below this range then we may see further declines toward 0.8320 which is the 0.618 FIB and 0.8250 which is the second target for this monthly bearish run at 1.618 FIB extension.
Monthly chart:

Weekly chart:


