|
Getting your Trinity Audio player ready...
|
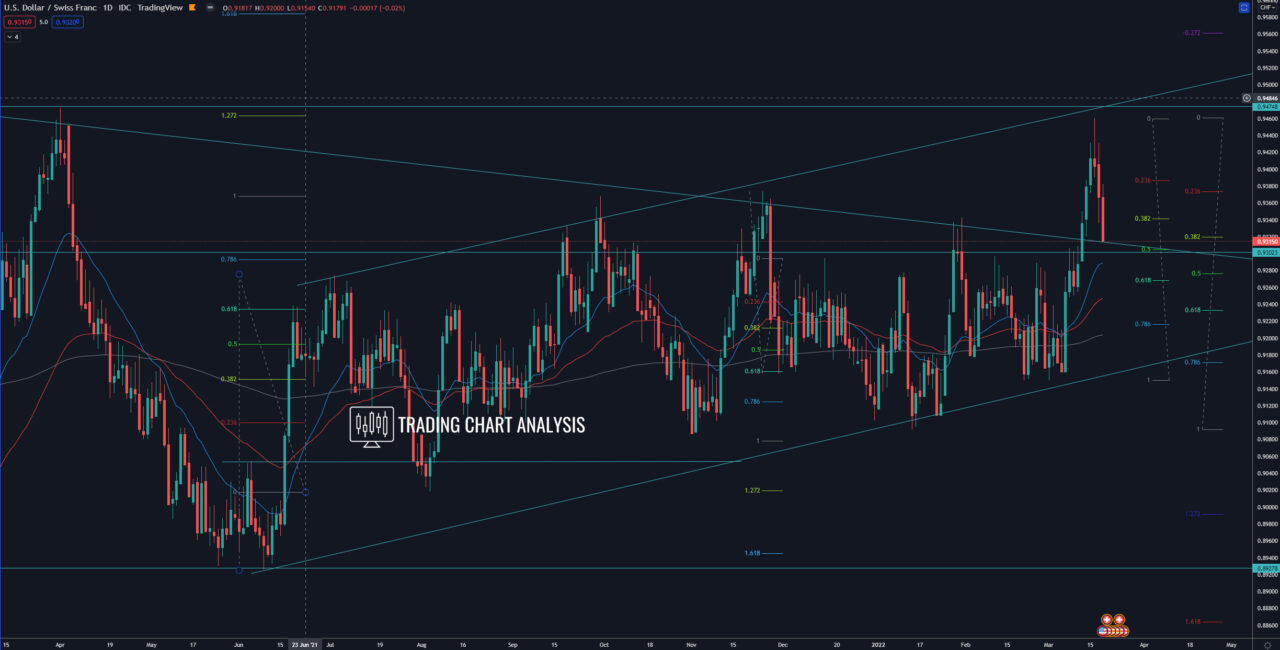
Technical Analysis for USD/CHF, the pair closed with a high-test candle on the weekly chart, rejecting the previous high and the 0.618 FIB retracement on the weekly chart at 0.9465, starting a pullback. The first target for this pullback is the 0.382 FIB retracement on the daily chart and the support zone between 0.9300-20. The second target for the USD/CHF, if the pair breaks below 0.9300, is the 0.618 FIB retracement on the daily chart around 0.9270-50. The third target is the support zone around 0.9185, where there is an ascending trend line.
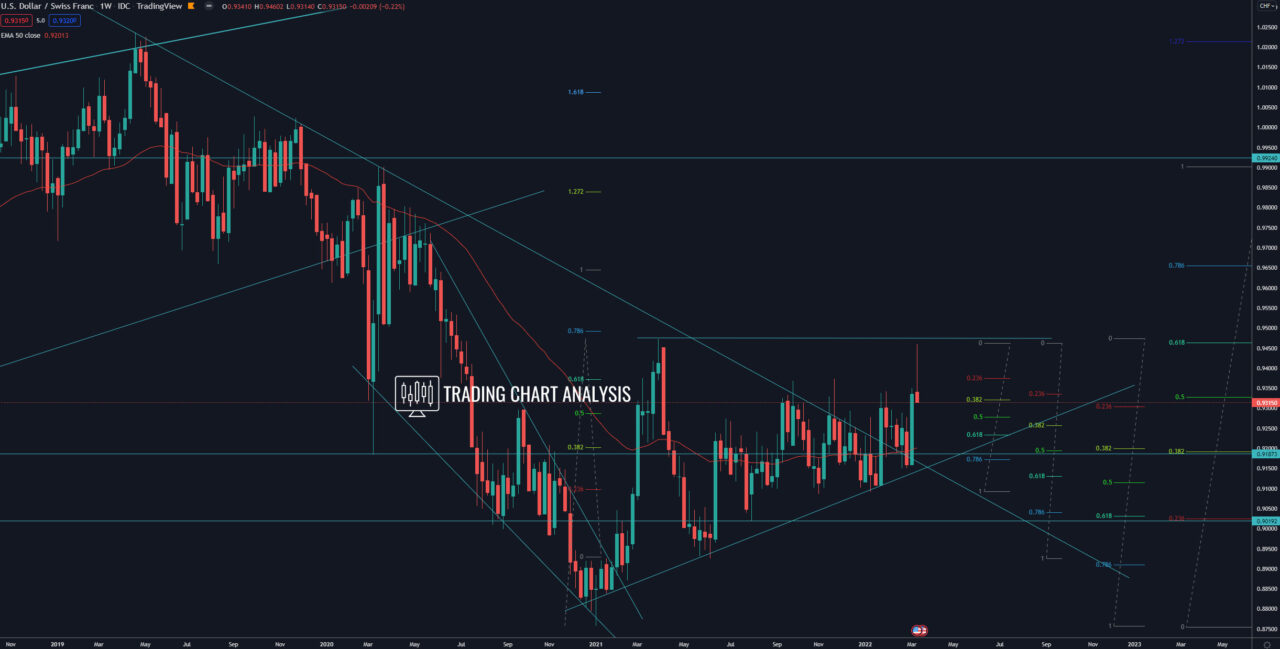
Looking at the bigger picture, the USD/CHF pair is forming ascending triangle on the weekly chart, which is bullish. If the USD/CHF breaks above the triangle, the 0.618 FIB retracement on the weekly chart at and above the high at 0.9473, will send the pair higher. The first target for this potential bullish breakout is the 0.618 FIB retracement on the monthly chart at 0.9670. The second target for the USD/CHF is the 1.272 FIB extension on the weekly chart at 0.9840.
Daily chart:

Weekly chart:


