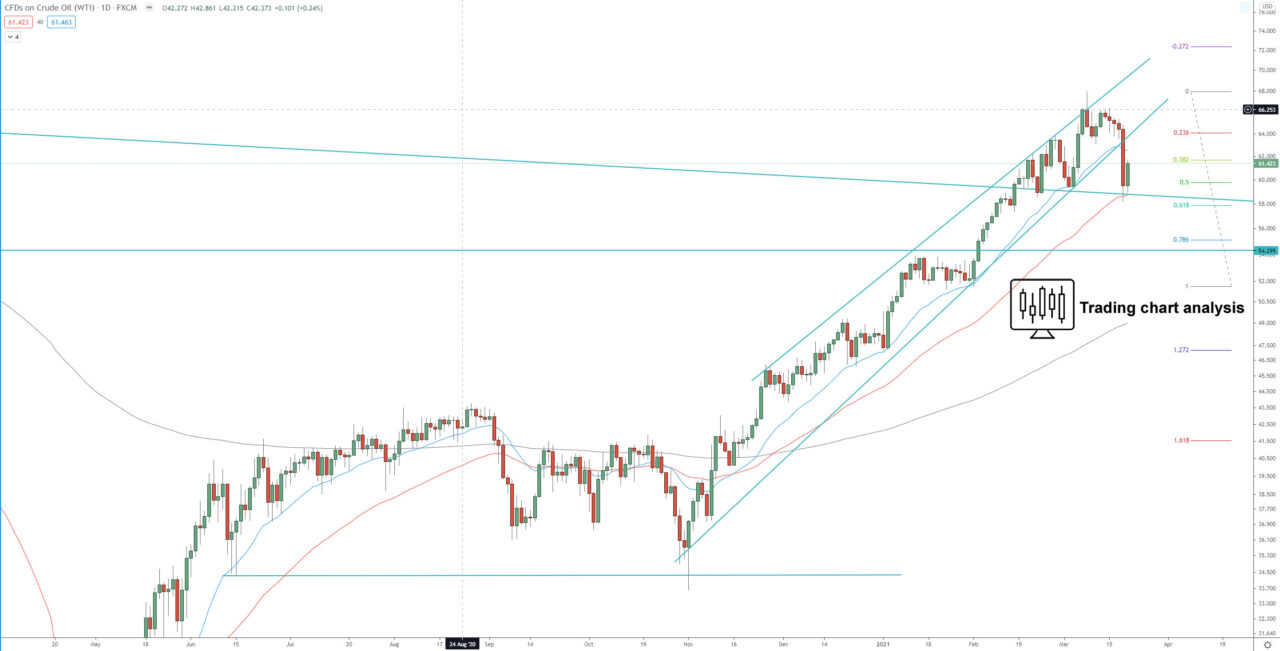
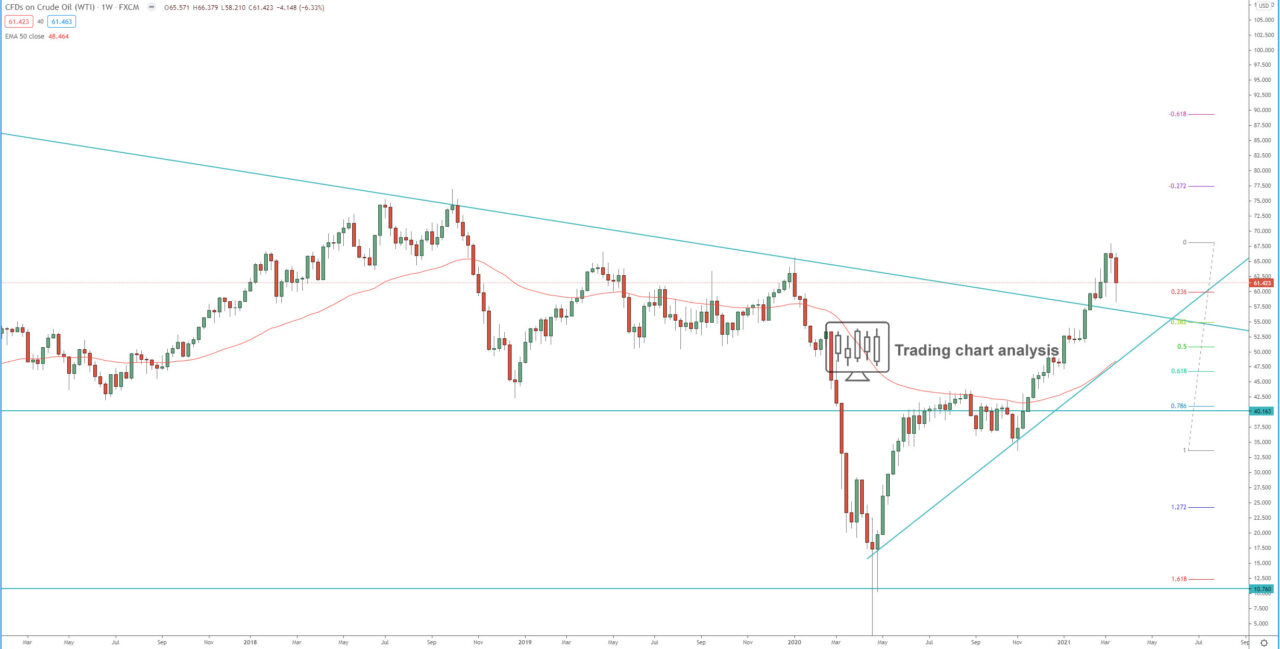
Technical analysis for the Crude Oil is relieving that the price almost reached the first target of the 3rd bullish daily wave at 1.618 FIB extension around 70.00. The price went as high as 67.94, touching both horizontal and dynamic resistance, and started pullback on both the weekly and the daily charts. This pullback reached the daily 50 EMA, support zone, and the 0.618 FIB retracement and bounced from it. However, the break below the dynamic support (ascending trend line) on the daily chart is a hint for the potential for further declines ahead. The focus for the week ahead is on the previous week’s low at 58.20, if the price break below that level, it will accelerate the decline toward the 0.386 FIB retracement of the last weekly run around 55.00.
On the other hand, if the price break above the previous daily high at 67.94, it will resume the bullish weekly and daily trends and send the price toward the 1.618 FIB extension of the daily bullish wave at 70.00, second toward the 1.272 FIB extension of the weekly bullish wave at 76.00.
Daily chart:

Weekly chart:

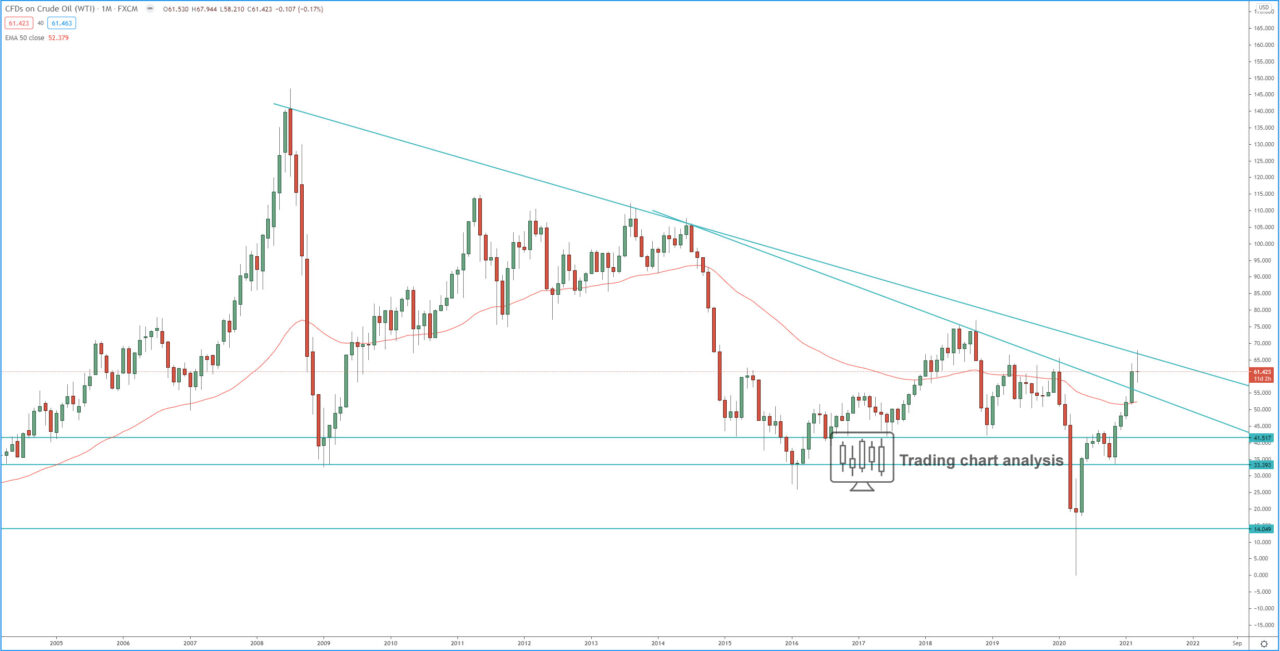
Monthly chart:


