|
Getting your Trinity Audio player ready...
|
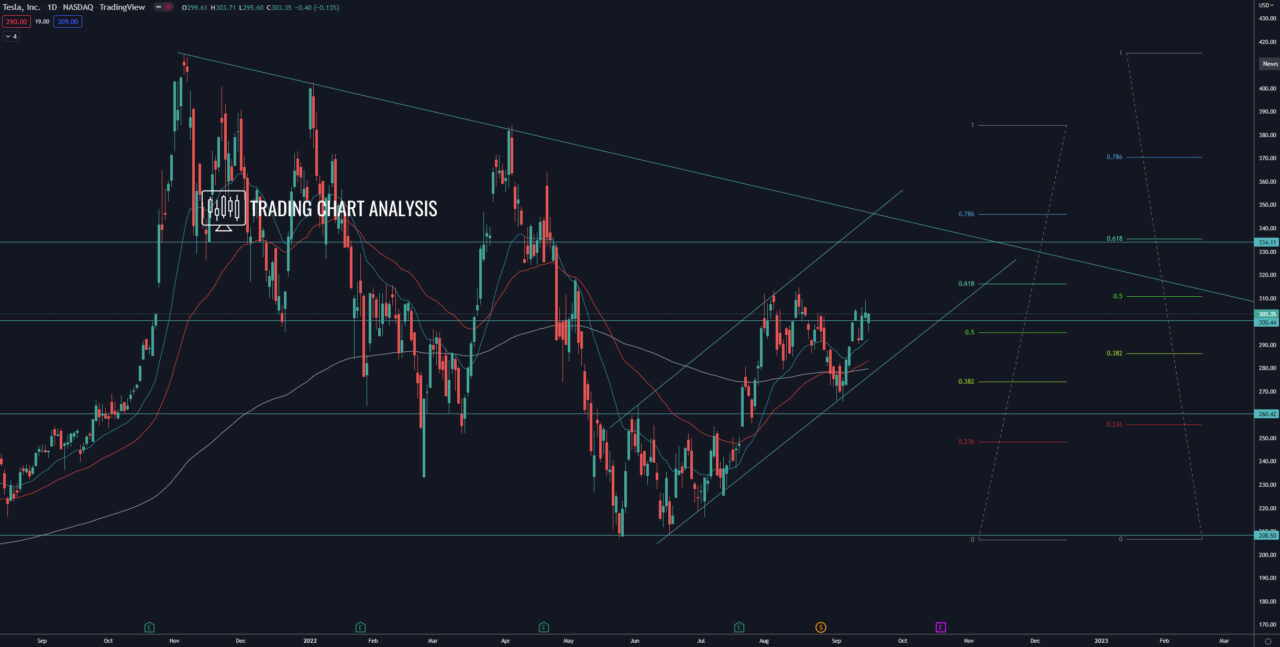
Technical analysis for Tesla(TSLA), the stock split didn’t help the bulls, and the price of the shares continued making lower highs and lower lows on the weekly chart, forming a potential Head & Shoulders pattern in the process. On both the daily and the weekly charts, the price of Tesla shares is sitting at resistance level. A break above the previous high on the daily chart at 306$ will open the door for a bullish run toward the resistance and 0.618 FIB retracement at 335$.
The focus now is on the previous daily low at 265$ and the bearish flag on the daily chart. A break below the bearish flag and the low on the daily chart will send the shares of Tesla (TSLA) lower toward the previous low and support at 208$.
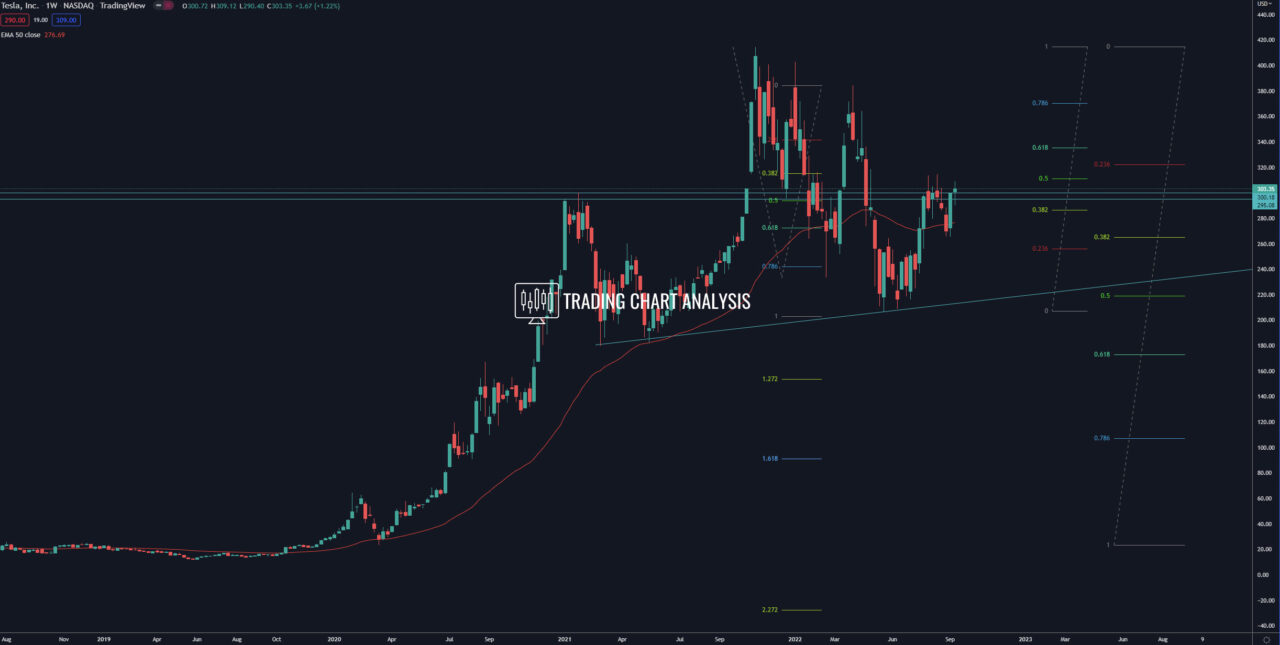
Looking at the bigger picture on the weekly chart, the shares of Tesla(TSLA) formed a potential Head & Shoulders pattern. A break below the neckline of this pattern will send the price of Tesla(TSLA) shares tumbling toward, first, the 0.618 FIB retracement on the weekly chart at 175$. The second target for this potential bearish development is the 1.272 FIB extension on the weekly chart at 155$. The third target is the 1.618 FIB extension on the weekly chart at 90$.
Daily chart:

Weekly chart:


