|
Getting your Trinity Audio player ready...
|
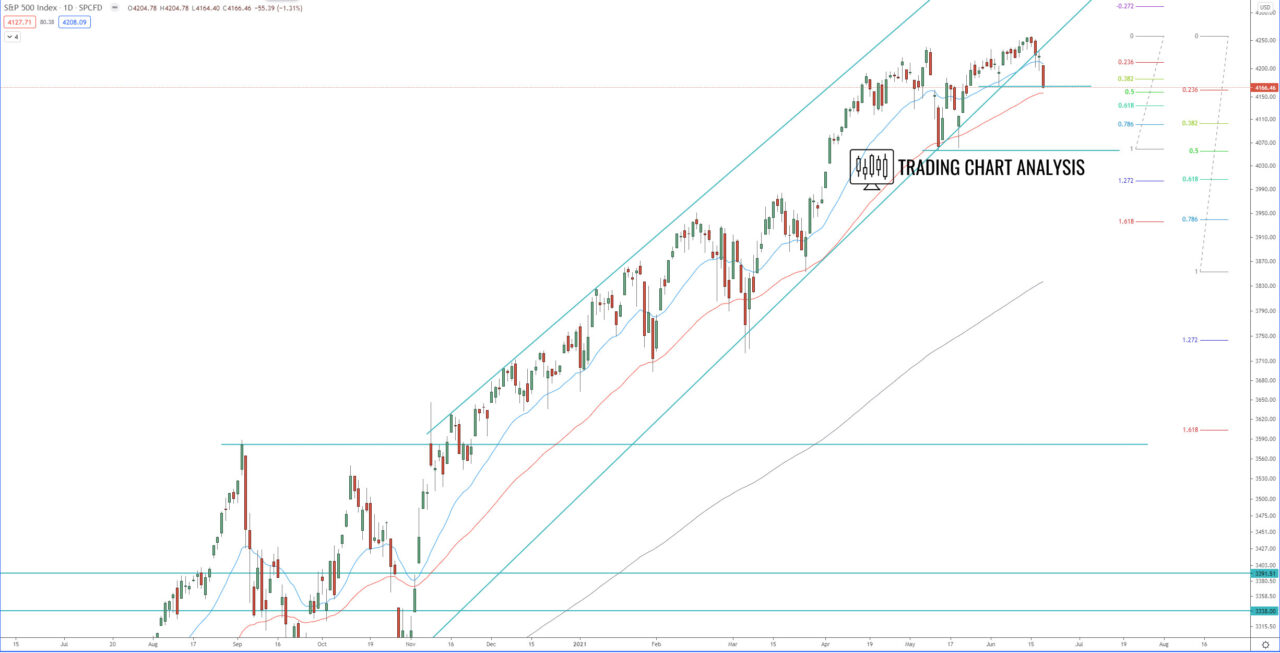
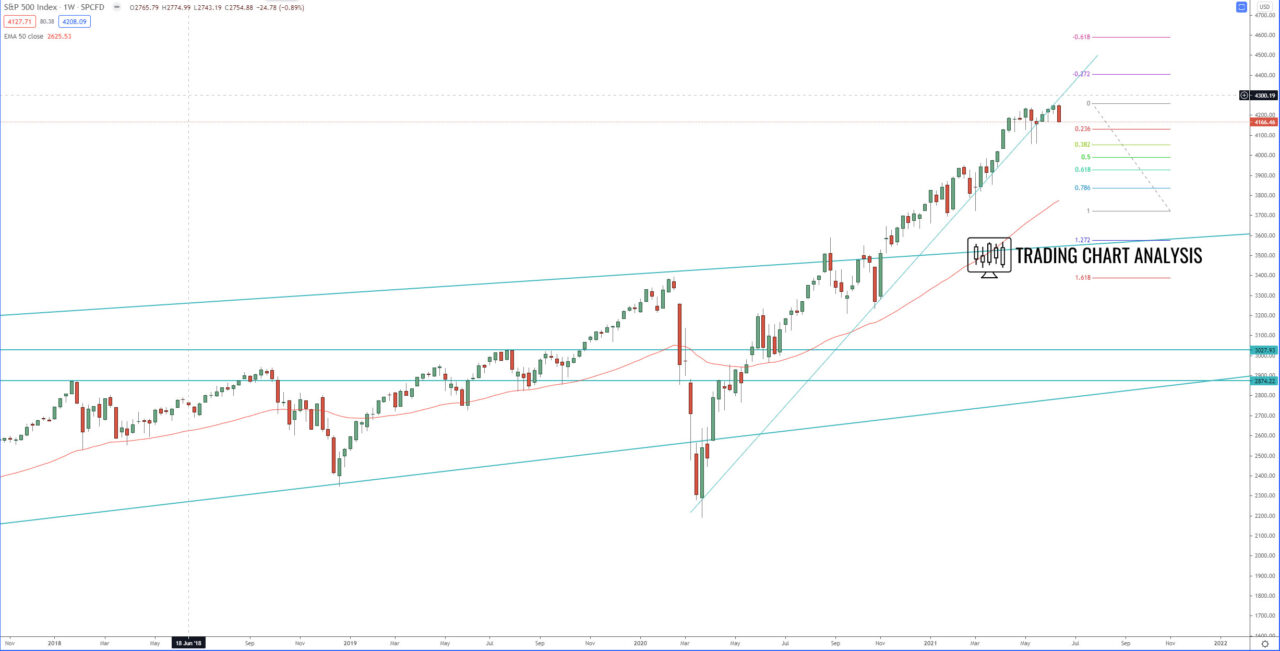
S&P 500 Technical Analysis, the index broke below ascending trend line on both the daily and the weekly chart, an early signal for a potential pullback. If the index break below the support between 4160-51, it will extend the bearish run toward 4118. Break below 4118 will send the S&P 500 to the previous low at 4056.
The focus for the week ahead is on the previous high at 4257, a break above it will resume the daily and the weekly bullish waves. The first target for the bullish weekly wave of the S&P 500 index is at the 1.272 FIB extension at 4290.
Review our technical analysis for the S&P 500 index, for targets for 2021.
Daily chart:

Weekly chart:


