|
Getting your Trinity Audio player ready...
|
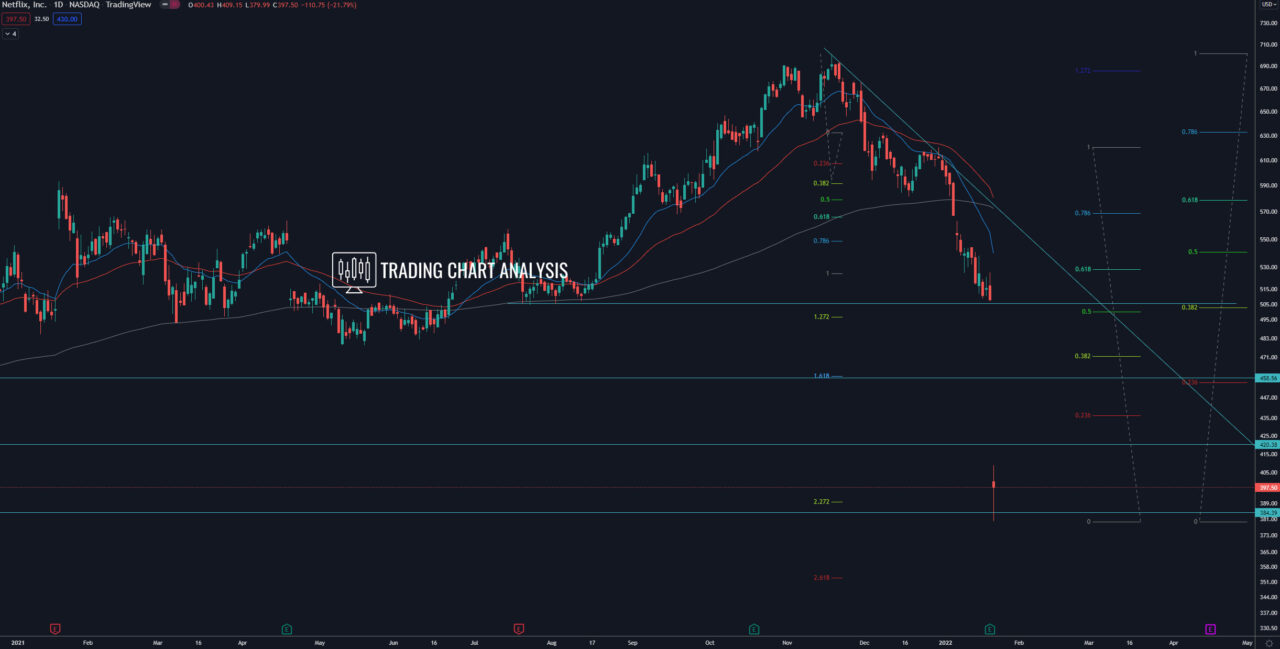
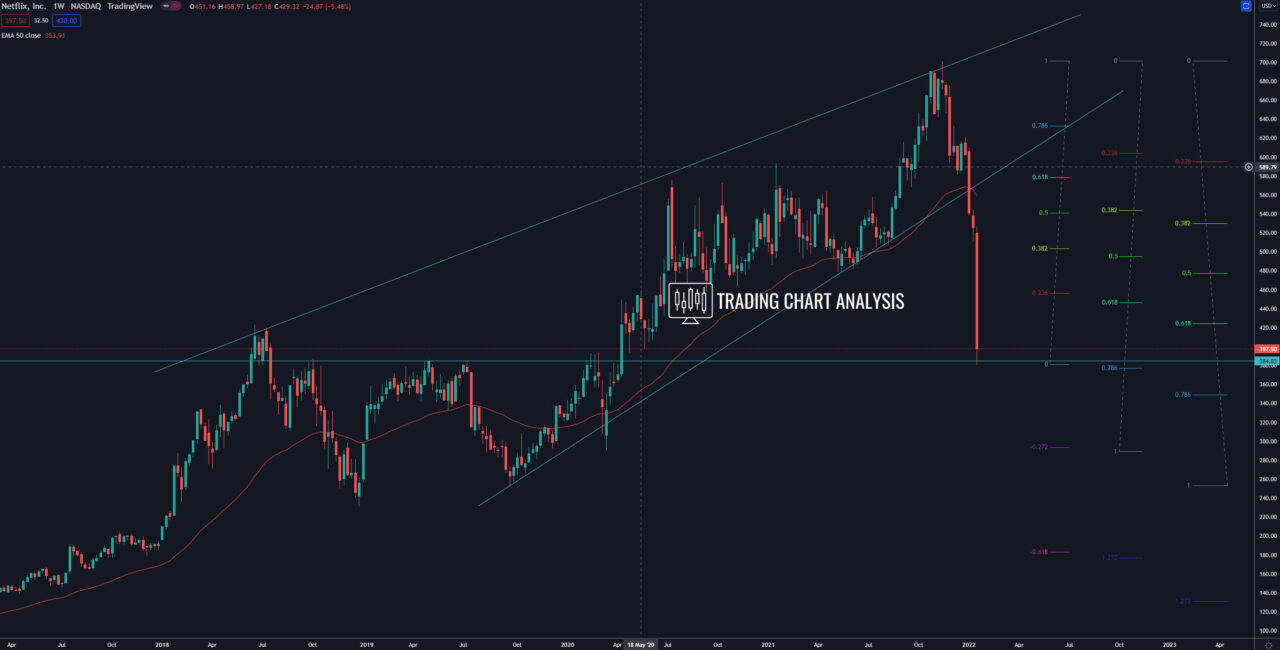
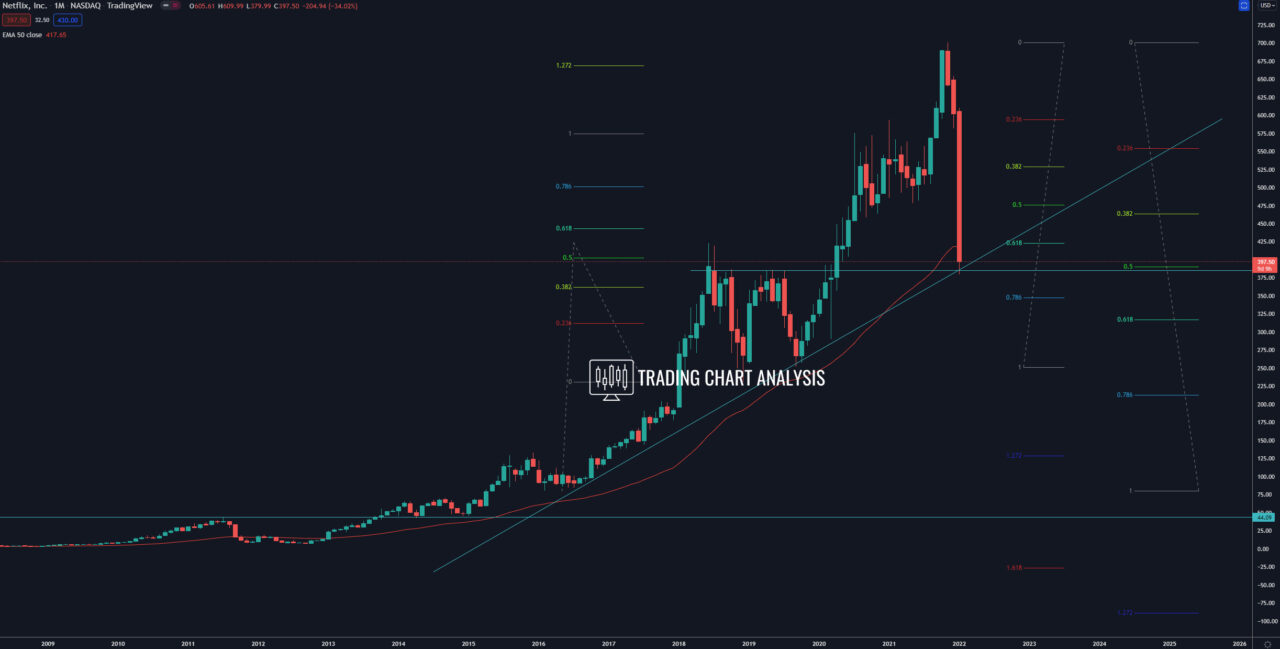
Technical analysis for Netflix (NFLX), the shares reached the third target of the fifth bullish wave on the monthly chart, the 1.272 FIB extension at 670$. The shares went as high as 700$ and started a pullback. The pullback turned to a bearish trend on both the weekly and the daily charts. The shares of Netflix reached the third target of the bearish wave on the daily chart at 2.272 FIB extension at 390$. The fourth target for the bearish wave on the daily chart is the 2.618 FIB extension on the daily chart between 350-355$.
On the monthly chart, the shares of Netflix are sitting at ascending trend line and support zone around 385$. If the price of the shares breaks below 385$, that will open the door for further declines. The first target for this potential breakdown is the support zone between 350-355$. The second target is the 0.618 FIB retracement on the monthly chart at 315-320$. The third target is the low on the monthly chart at 255$.
On the other hand, if the shares of Netflix (NFLX) manage to hold above the support zone and ascending trend line on the monthly chart, above 380$, that could lead to consolidation and eventually a pullback. The first target of this potential pullback is the 0.382 FIB retracement at 500$, which will fill the gap on the daily chart. The resistance zone at the beginning of the gap on the daily chart around 500$ will be watched by traders and hedge funds for selling opportunities.
Daily chart:

Weekly chart:

Monthly chart:


