|
Getting your Trinity Audio player ready...
|
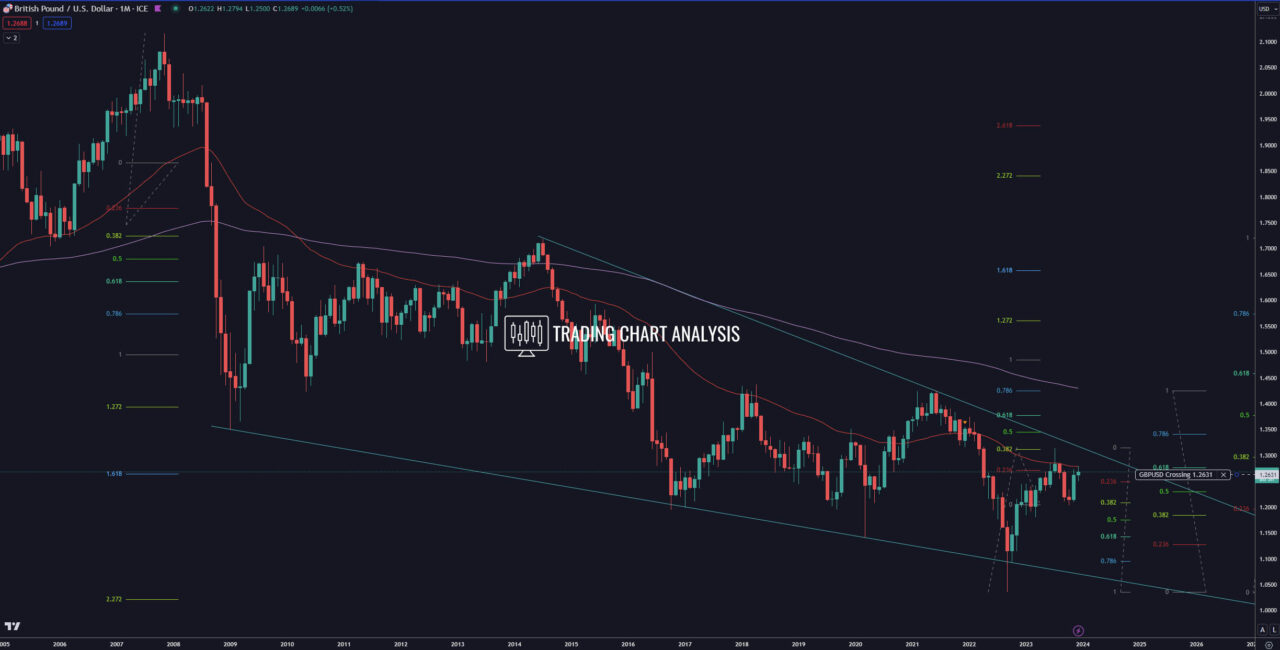
In our detailed GBP/USD technical analysis, the currency pair has recently encountered a critical juncture, marked by a rejection of the 0.618 Fibonacci retracement with a high-test candle on the monthly chart. Delving into the long-term perspective, our exploration of the monthly chart reveals a prevailing bearish trend that has staunchly rebuffed the 0.618 Fibonacci retracement, signaling potential future developments.
Bearish Momentum: Targets and Trends
- Primary Bearish Target: 2.272 FIB Extension (Monthly) – 1.0200-1.0220 The ongoing bearish trend on the monthly chart eyes the third target at the 2.272 Fibonacci extension, hovering around 1.0200-1.0220. This level, almost reached during the September 2022 plunge when GBP/USD touched 1.0354, is a pivotal marker for future market dynamics.
- Bullish Pullback and Retracement: Monthly Chart Insights Following the September 2022 low, the market initiated a pullback, reaching the 0.618 Fibonacci retracement on the monthly chart before being rejected with a high-test candle. The subsequent retracement of the bullish run extended to the 0.382 Fibonacci retracement at 1.2080, witnessing a bounce at 1.2038.
Weekly Chart Dynamics: Head and Shoulders Potential
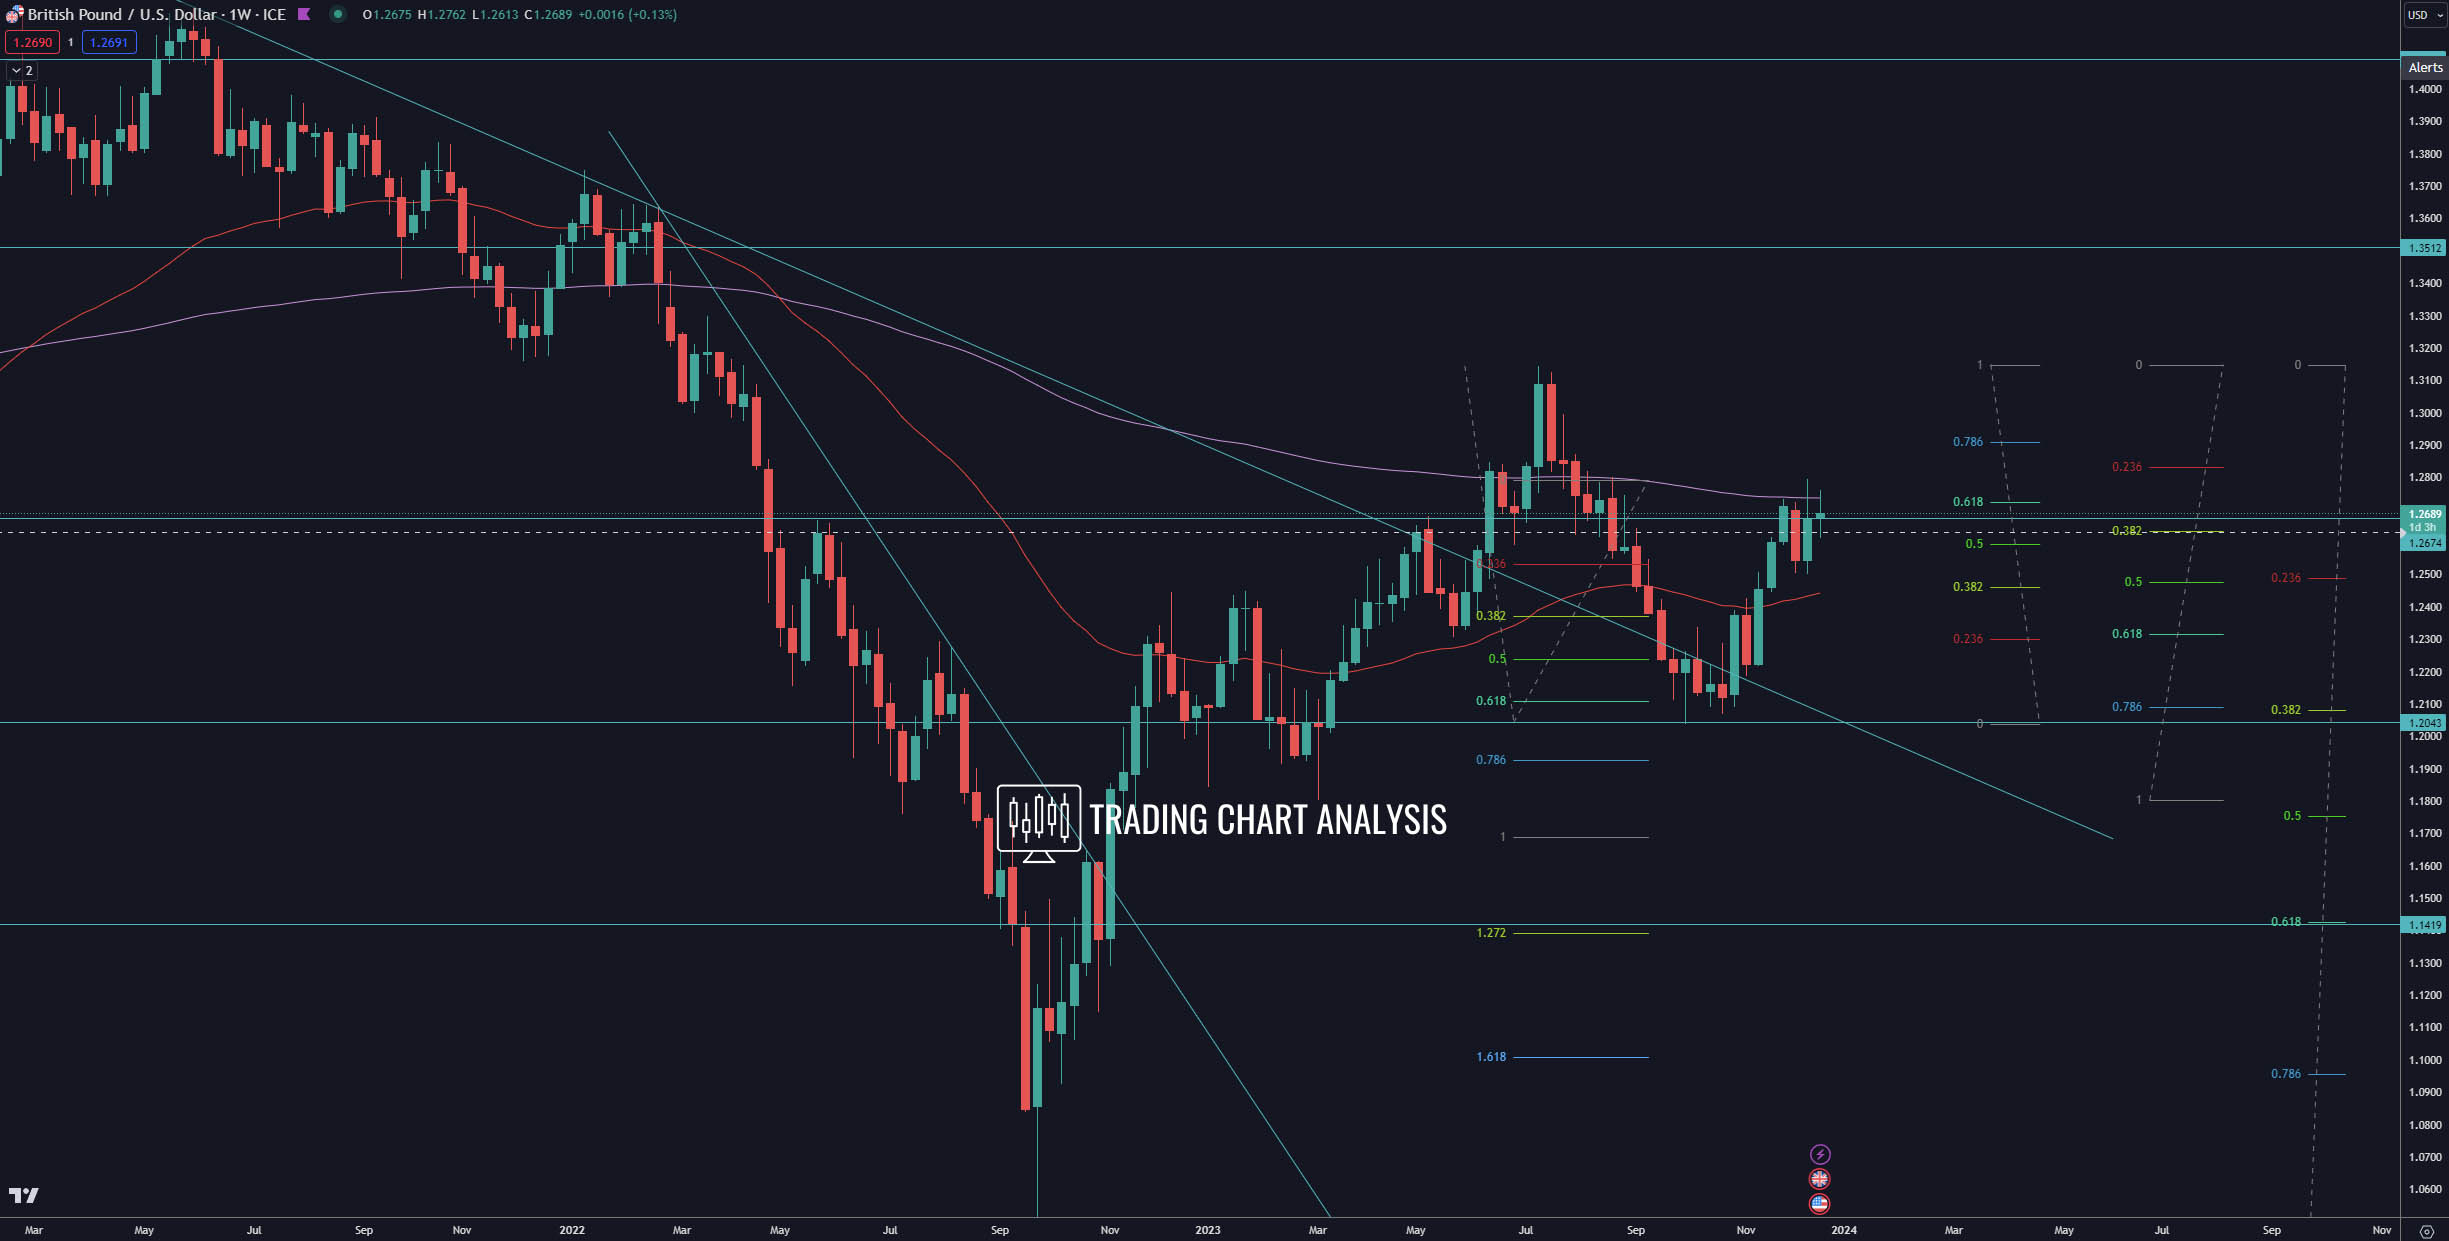
- Bearish Signal: Right Shoulder Formation – 0.618 FIB Retracement (Weekly) – 1.2725 Currently, GBP/USD has approached the 0.618 Fibonacci retracement on the weekly chart around 1.2725, resembling the right shoulder of a potential Head and Shoulders pattern. A break below the weekly low at 1.2084 would trigger a bearish scenario.
- Bearish Targets: 0.618 FIB Retracement (Weekly) – 1.1430 & 0.786 FIB Extension (Weekly) – 1.0950 In the event of a bearish development, the first target is the 0.618 Fibonacci retracement at 1.1430, also a 1.272 Fibonacci extension on the weekly chart. Subsequently, the second target lies at 0.786, approximately 1.0950, representing a 1.618 Fibonacci extension on the weekly chart.
Bullish Potential: Awaiting Confirmation
- Bullish Signal: Break Above 0.618 FIB Retracement (Weekly) & High at 1.2794 Conversely, a break above the 0.618 Fibonacci retracement on the weekly chart and the high at 1.2794 signifies potential bullish momentum. This opens the door for a run toward the previous monthly and weekly high at 1.3143.
- Bullish Targets: 0.786 FIB Retracement (Monthly) – 1.3410 & 0.618 FIB Extension (Monthly) – 1.3775 In a bullish scenario, breaking above the monthly high at 1.3143 carries substantial bullish implications. The first target is the 0.786 Fibonacci retracement on the monthly chart at 1.3410, followed by the second target at the 0.618 Fibonacci extension on the monthly chart, positioned at 1.3775.
As the GBP/USD landscape unfolds, strategic insights and careful monitoring of key levels are essential for informed decision-making in this dynamic currency market.
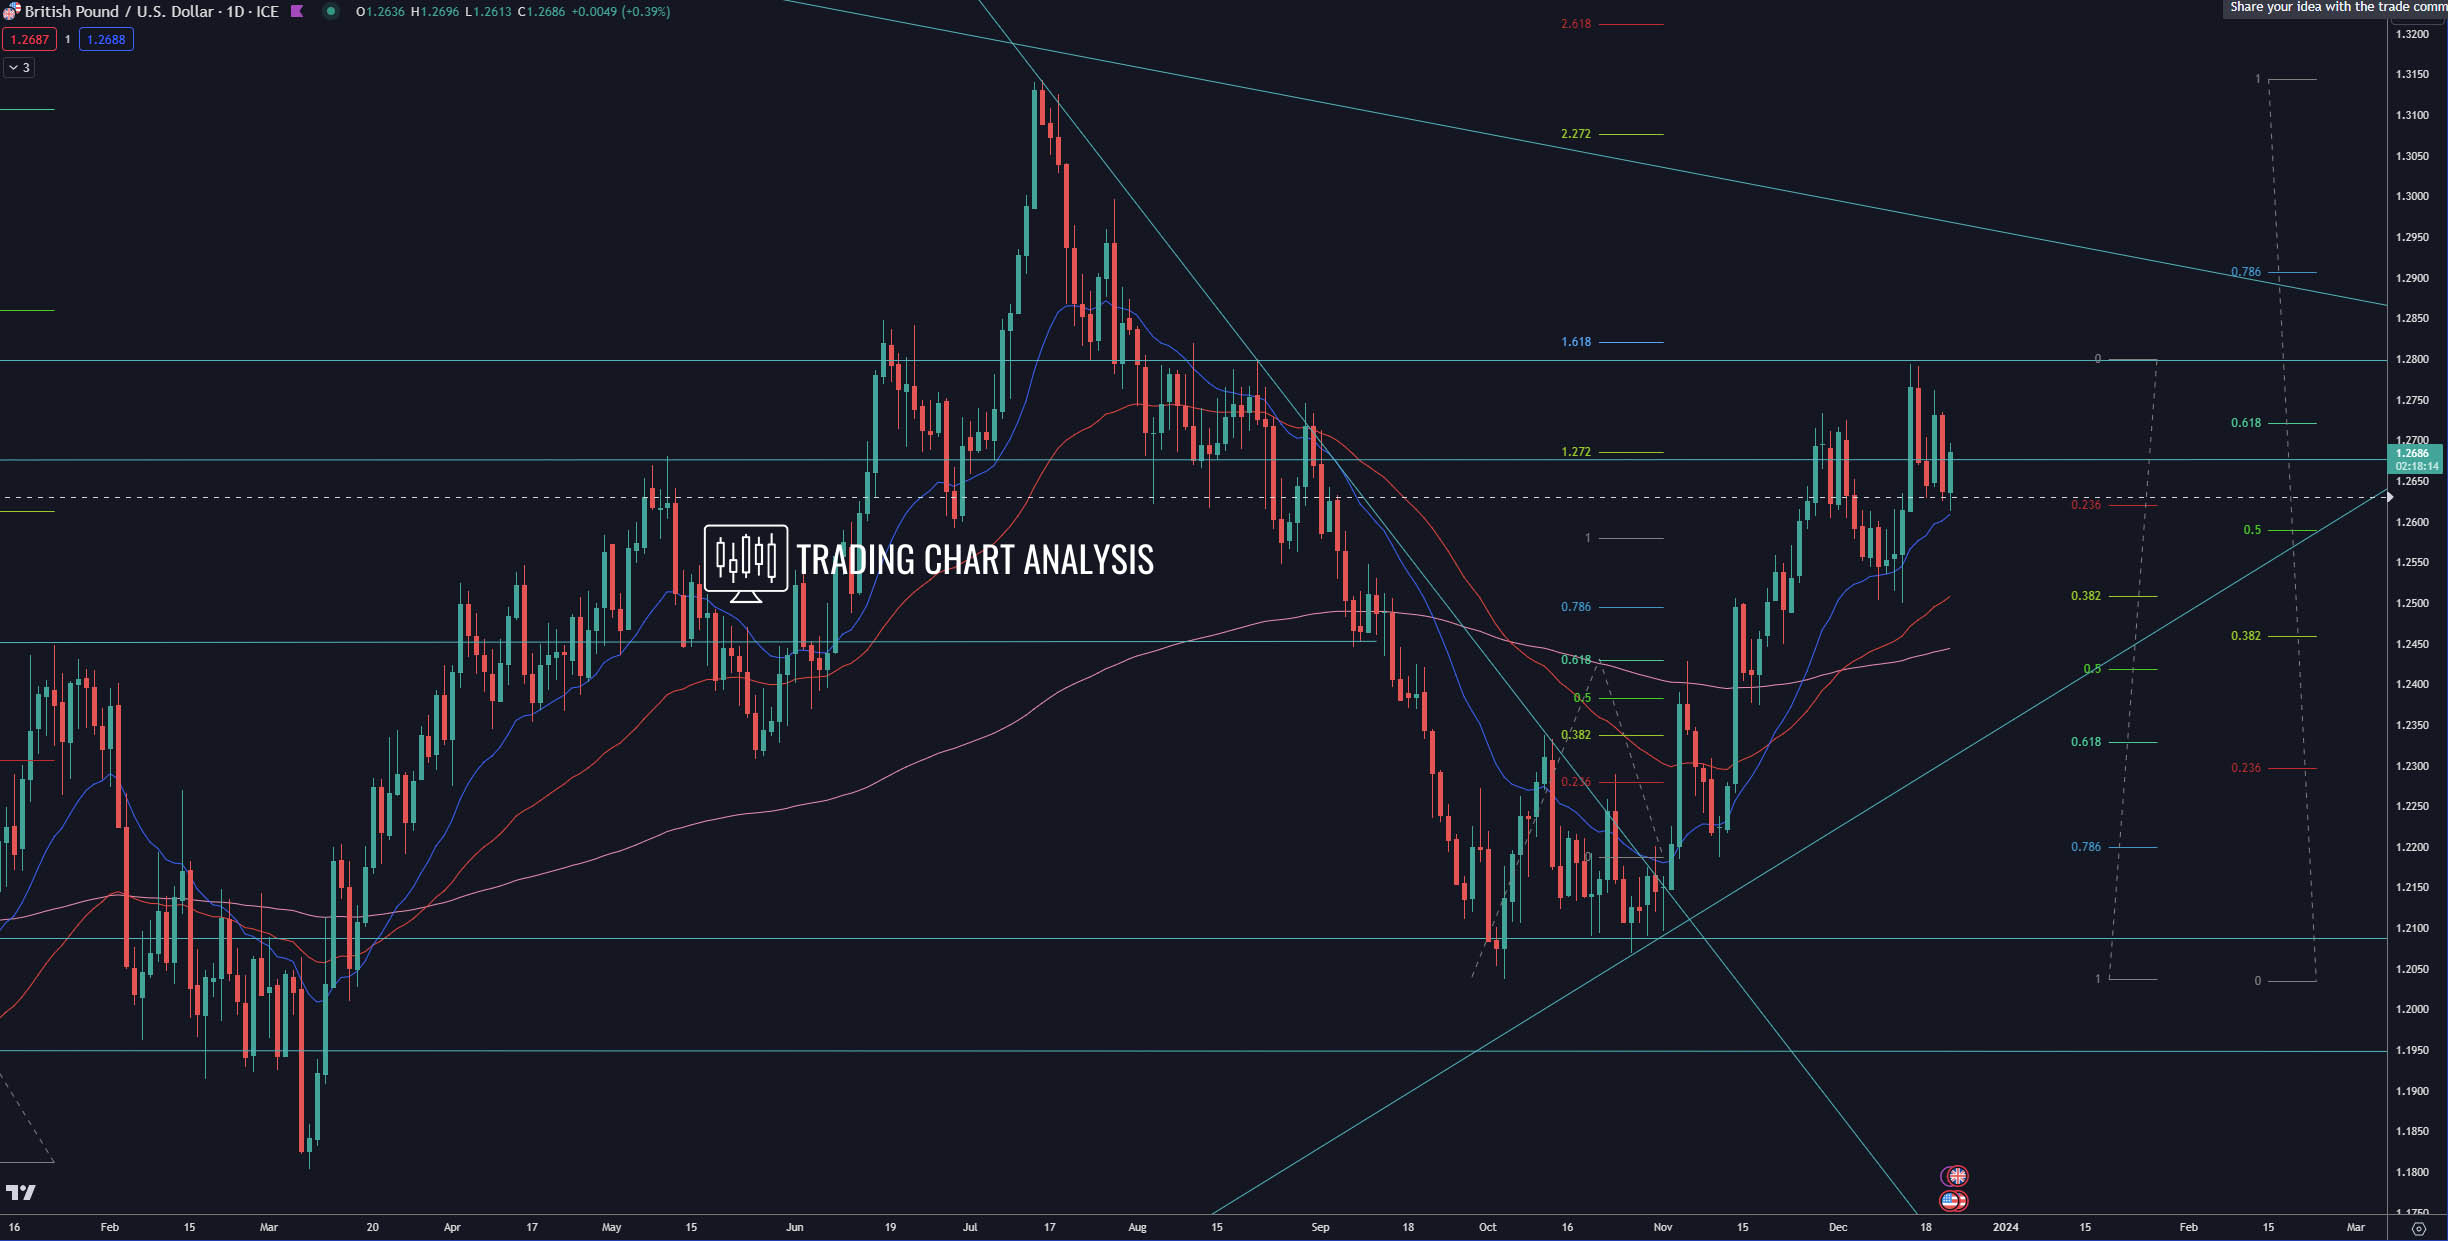
Daily chart:

Weekly chart:

Monthly chart:


