Technical analysis for 2021.
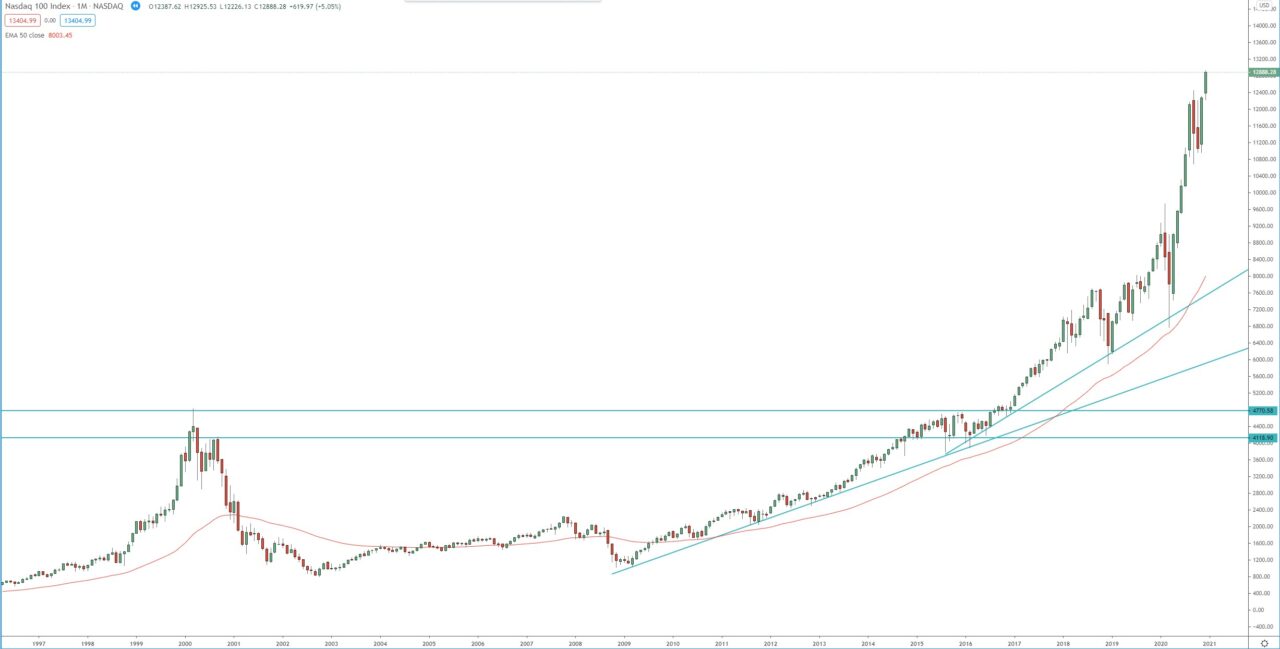
Studying the monthly chart, we can see that after the break above the 2000 high in 2016, the index accelerated to the upside and reached the target of this break in December 2019, when the index reached 8800. After that because, of the COV19 pandemic, we witnessed bearish market which started in February of 2021. The uncertainty, because of COV19 shutdown, lead to liquidity crisis in the bond markets and forced the FED to step in and to provide liquidity and credits with various lending programs. Congress acted as well with few stimulus bills, designed to provide loans to business and to help the economy. All this liquidity especially the one provided by the FED was enough, not only to stop the bearish moves in the stock markets, but was enough to eventually lift the NASDAQ above pre-pandemic high.
The breakout above the pre-pandemic high was a continuation of the wave started with the 2016 break out, at the present both targets of that wave were reached, the first at 1.272 FIB extension around 10 900, was reached in July 2020, the second at 1.618 FIB extension around 12 270 was reached in September 2020. After that the market started a correction that let to 14.00% decline the index. Since then, NASDAQ broke above the September high and is on its way toward the 2.72 FIB extension around 14 870. From the previous bullish waves on the monthly chart there are multiple FIB extension landing around 14 350, therefore the range between 14 .350 – 14 870 is the target for the current bullish leg and the target for the 2021.
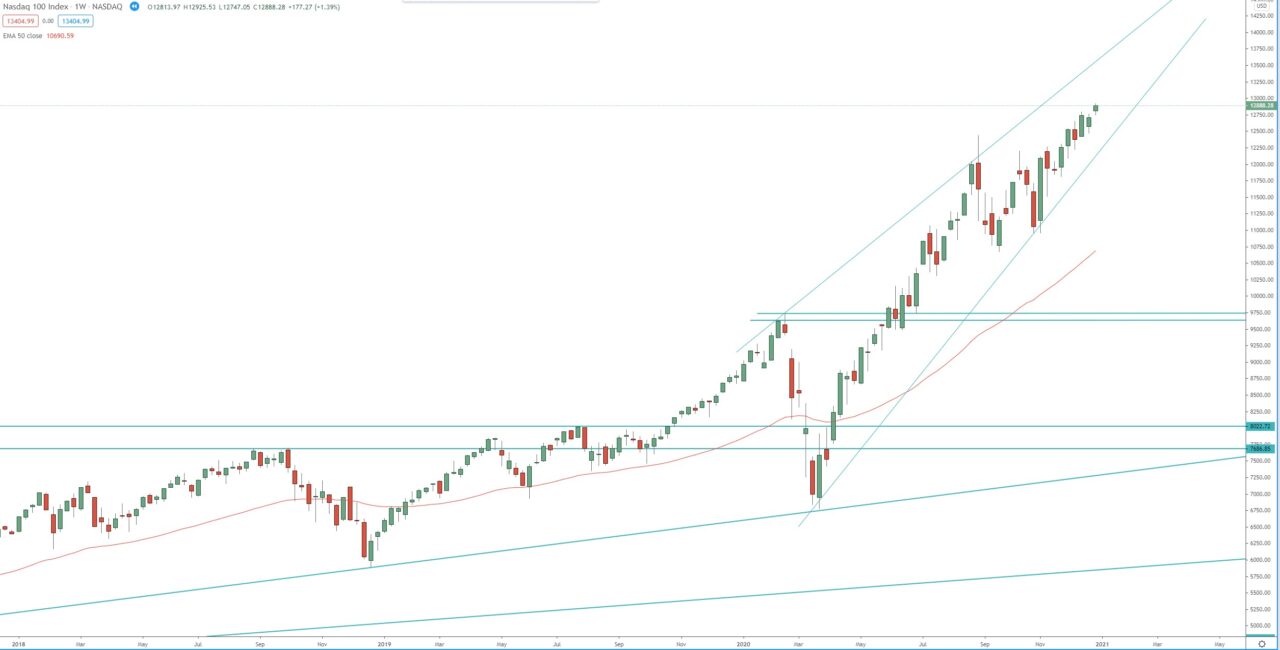
On the weekly chart we can see that the price action is forming ascending wedge, break out of this wedge will trigger the next major pullback in the index.
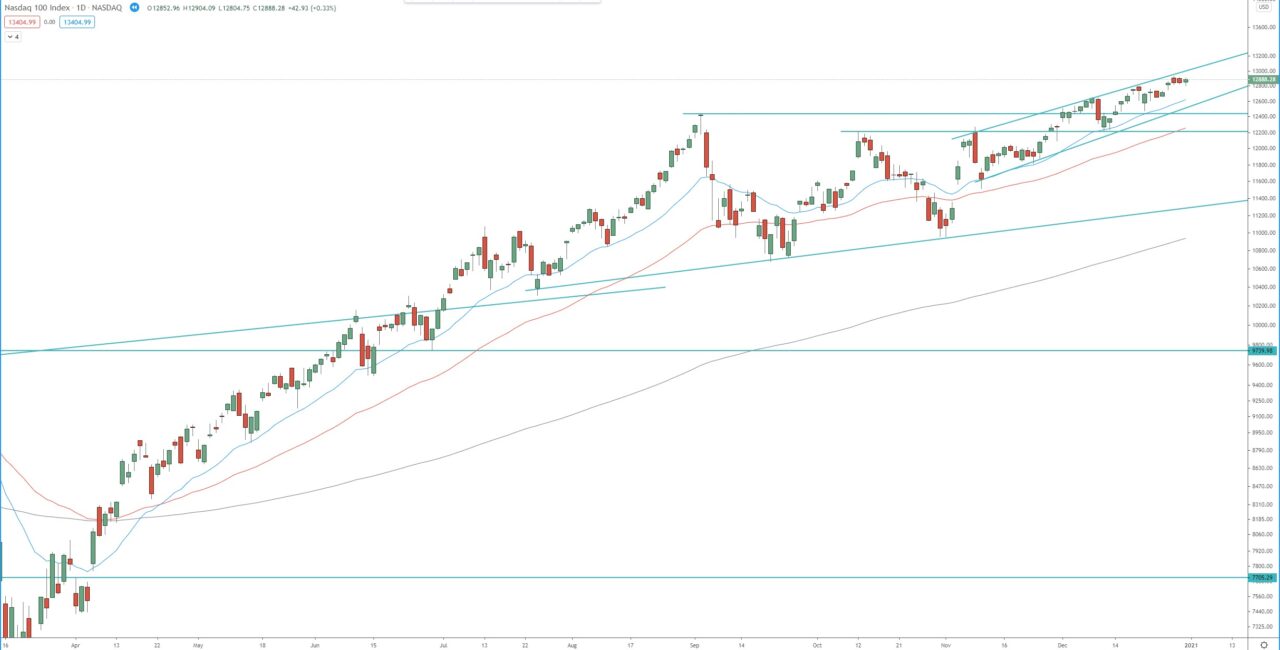
The daily chart is within its 3rd bullish wave and already reached the 1.618 FIB extension around 11 780 and now the index is on its way toward first 2.272 FIB around 13 170, next target is the 2.618 FIB extension around 13 900. Depending on how the price action develop, we may see that when the price reach the range between 13 900 – 14 000 it is also possible to touch the top of the weekly wedge and therefore we should watch that range for rejection and the beginning of consolidation and pullback in the index.
Monthly chart:

Weekly chart:

Daily chart:


