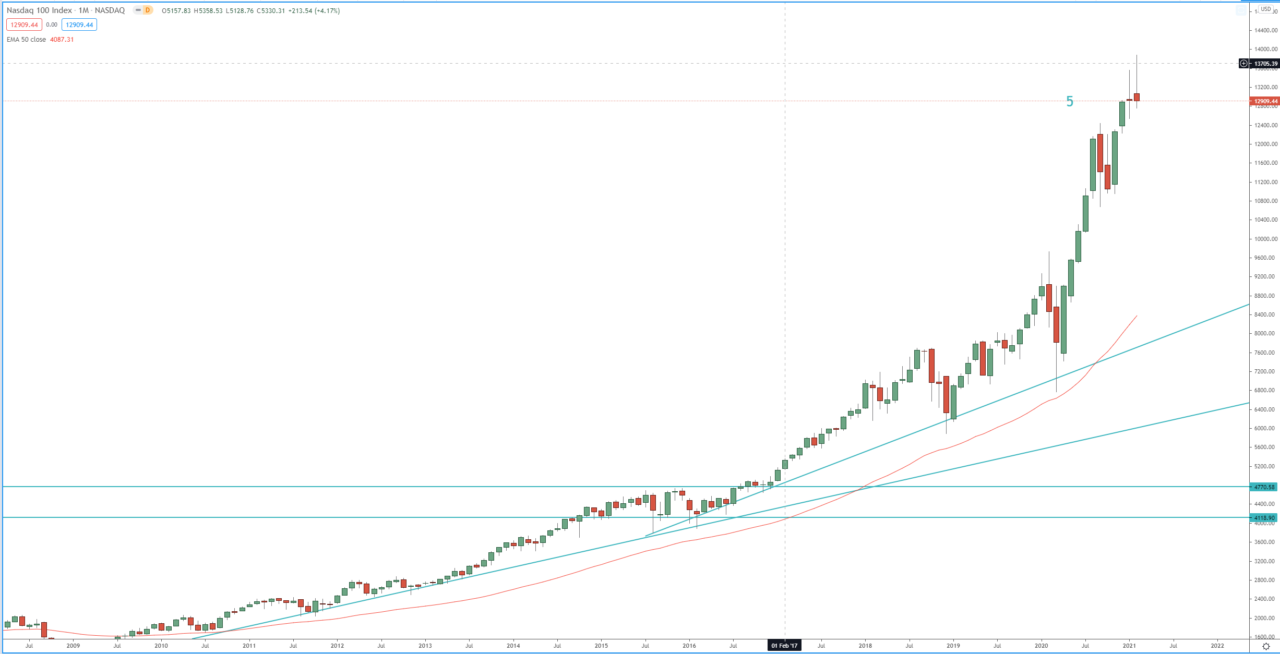
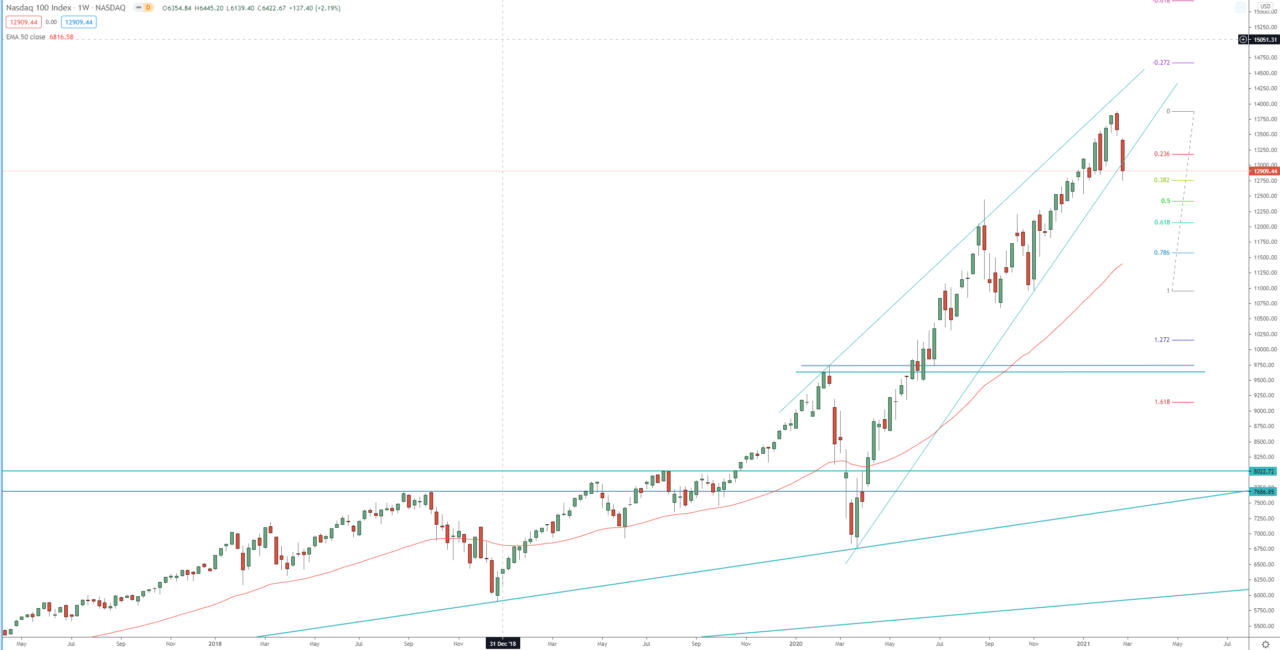
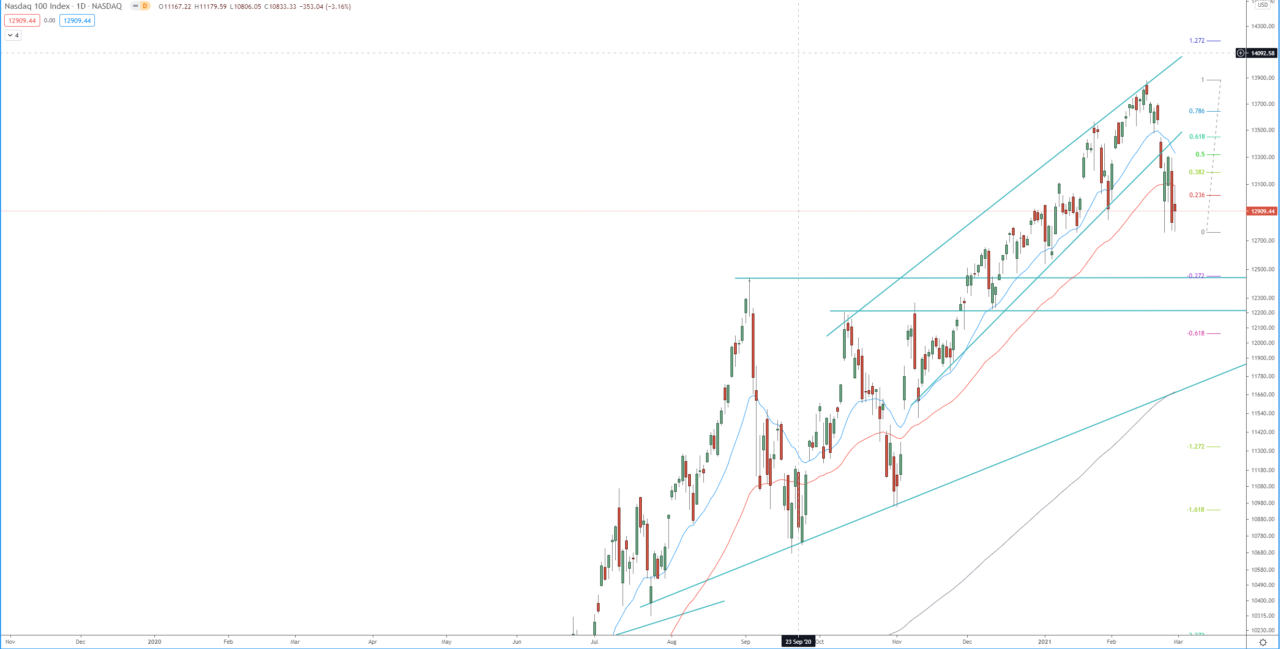
The price almost reached the 4th target of the 3rd bullish daily wave at 2.618 FIB extension around 13 900 and started a pullback on the daily chart. This pullback on the daily chart materialized as a bearish run on the 1H chart. The price reached the 3rd target of the 3rd wave of that bearish 1H run at 2.727 FIB extension around 12 770, reaching and briefly exceeding the previous daily low. This 1H bearish run and daily pullback materialize with a break below a bearish flag on the daily chart, break below the daily 50 EMA, and tweezer tops on the monthly chart, signaling the potential for a further decline in the index.
Therefore, if the price break below last week’s low at 12 758, it will start 3rd bearish run on the 4H chart and extend the daily pullback. The first target of that run is at 1.272 FIB extension around 11 880 the second target is the 1.618 extension around 11 500.
On the other hand, if the price breaks back above 13 315 it will be a signal for resumption of the daily bullish trend and send the price first toward 13 565, and second toward the previous high at 13 879.
Review our technical analysis for 2021 for NASDAQ 100 index.
Monthly chart:

Weekly chart:

Daily chart:


