|
Getting your Trinity Audio player ready...
|
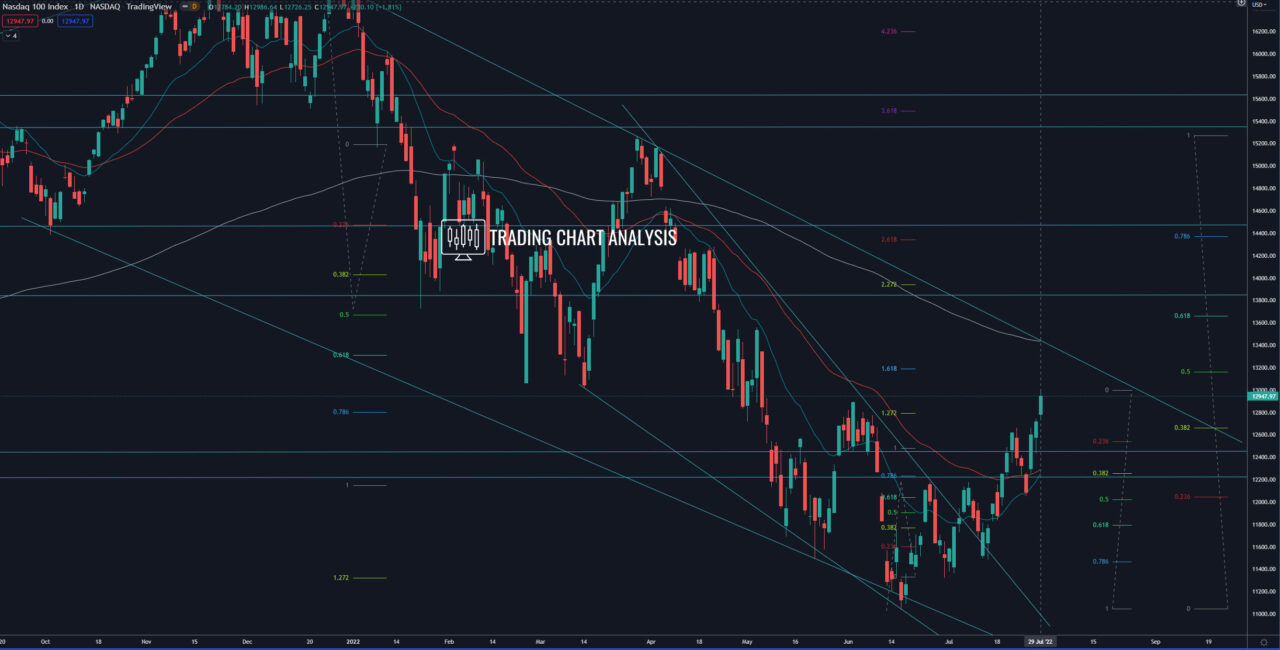
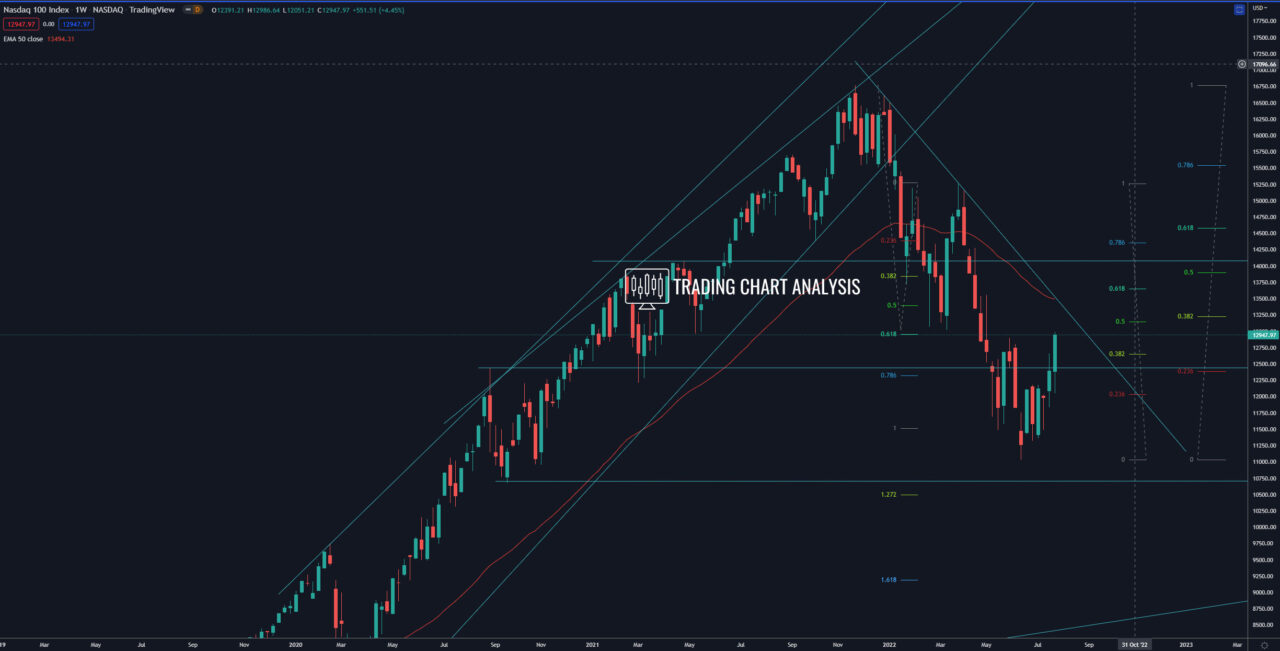
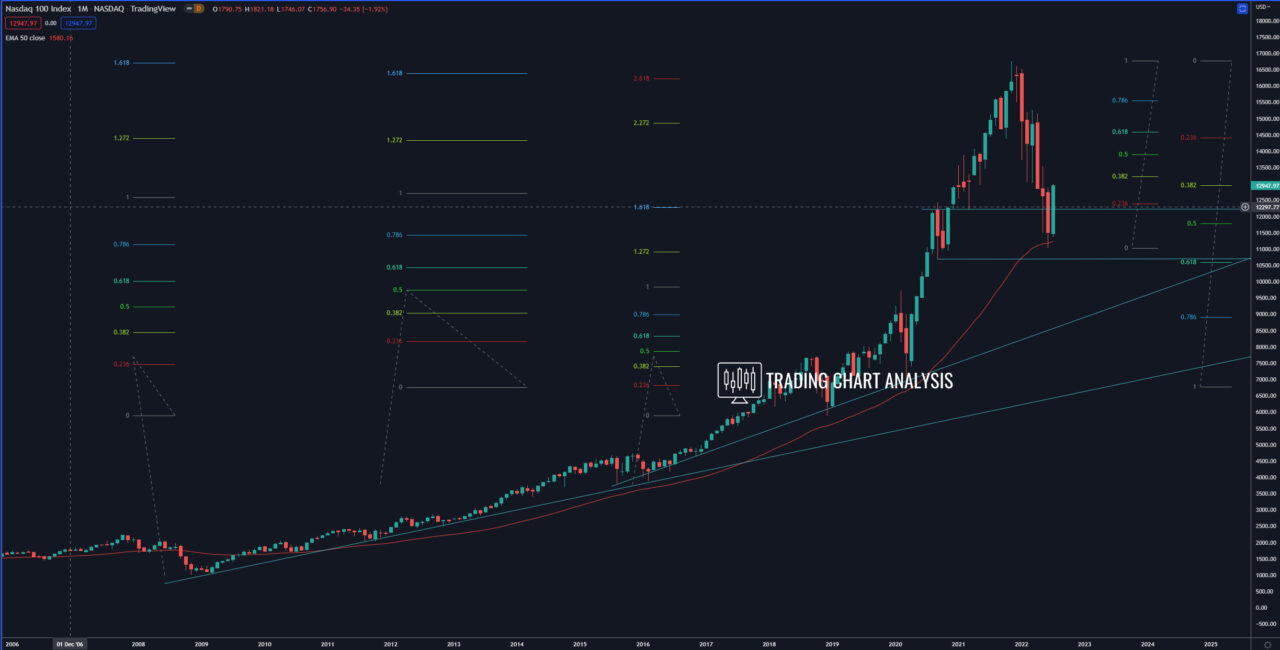
Technical analysis for Nasdaq 100, the index extended the pullback on the weekly chart and closed the month with a bullish engulfing pattern on the monthly chart, starting a pullback on the monthly chart. The first target for the pullback is the 0.382 FIB extension on the monthly chart at 13 220, which is the 1.618 FIB extension on the daily chart. The second target is the 0.618 FIB retracement on the weekly chart at 13 645. The third target for the pullback in Nasdaq is the 0.618 FIB retracement on the monthly chart at 14 580.
The focus now is on the support zone between 12 250 – 12 050, break below this support zone will signal the end of the pullback and resumption of the bearish trend for the Nasdaq index .
Looking at the bigger picture, the bearish wave for Nasdaq didn’t reach the first target on the weekly chart, the 1.272 FIB extension at 10 500, which is also the 0.618 FIB retracement on the monthly chart. Therefore, at some point in the future, we can expect that the Nasdaq index will hit this target.
Daily chart:

Weekly chart:

Monthly chart:


