|
Getting your Trinity Audio player ready...
|
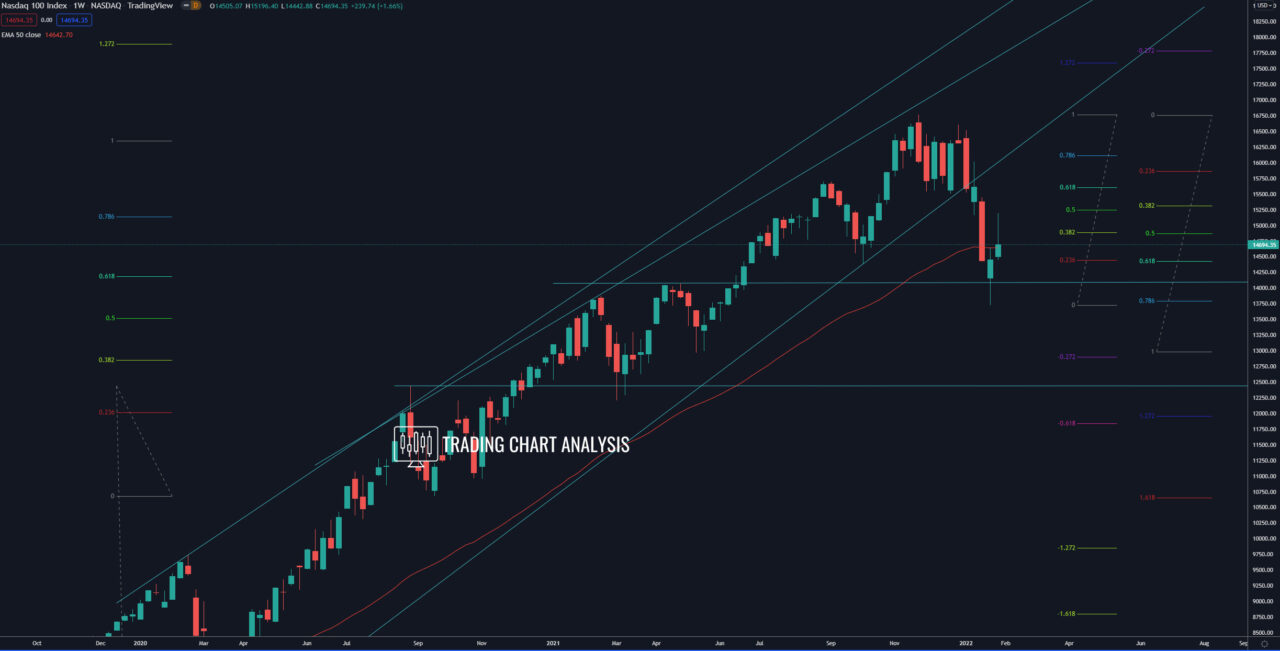
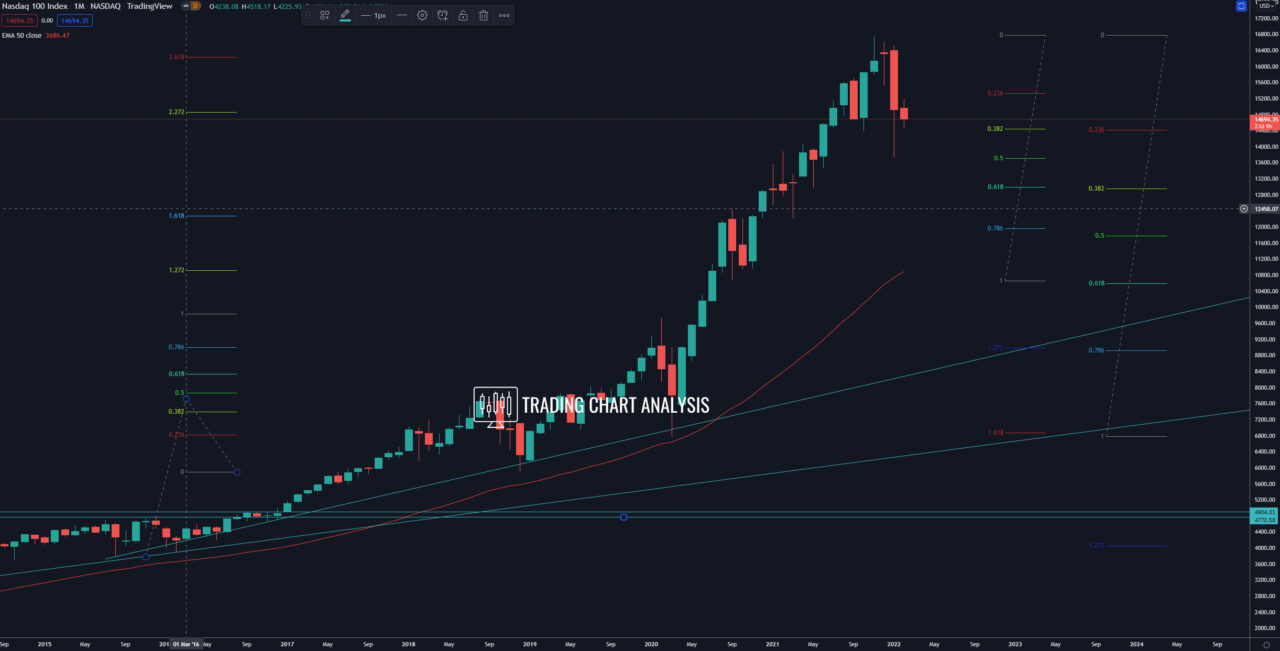
Technical analysis for NASDAQ, the index bounced from 0.382 FIB retracement on the monthly chart and 0.618 FIB retracement on the weekly chart at 14 430, starting a pullback on the daily chart. The first target for this pullback, the 0.382 FIB retracement on the daily chart at 14 830, was reached. The second target is the 0.618 FIB retracement on the daily chart at 15 510. If the NASDAQ 100 index breaks above 15 510, that will send the index higher toward first, the 16 017, and second the all-time high at 16 764.
On the other hand, if the index NASDAQ 100 star trading and holding below the 0.382 FIB retracement on the monthly chart and below the 0.618 FIB on the weekly chart at 14 430, that will be a signal for further declines and a breakout. A break below the previous weekly low at 13 724 will send the NASDAQ 100 lower. The first target for such a bearish breakout is the 0.618 FIB retracement on the monthly chart at 12 950 – 13 000. And a break below the 13 000-12 950 will send NASDAQ 100 tumbling toward the 0.618 FIB retracement on the monthly chart at 10 600.
Weekly chart:

Monthly chart:


