|
Getting your Trinity Audio player ready...
|
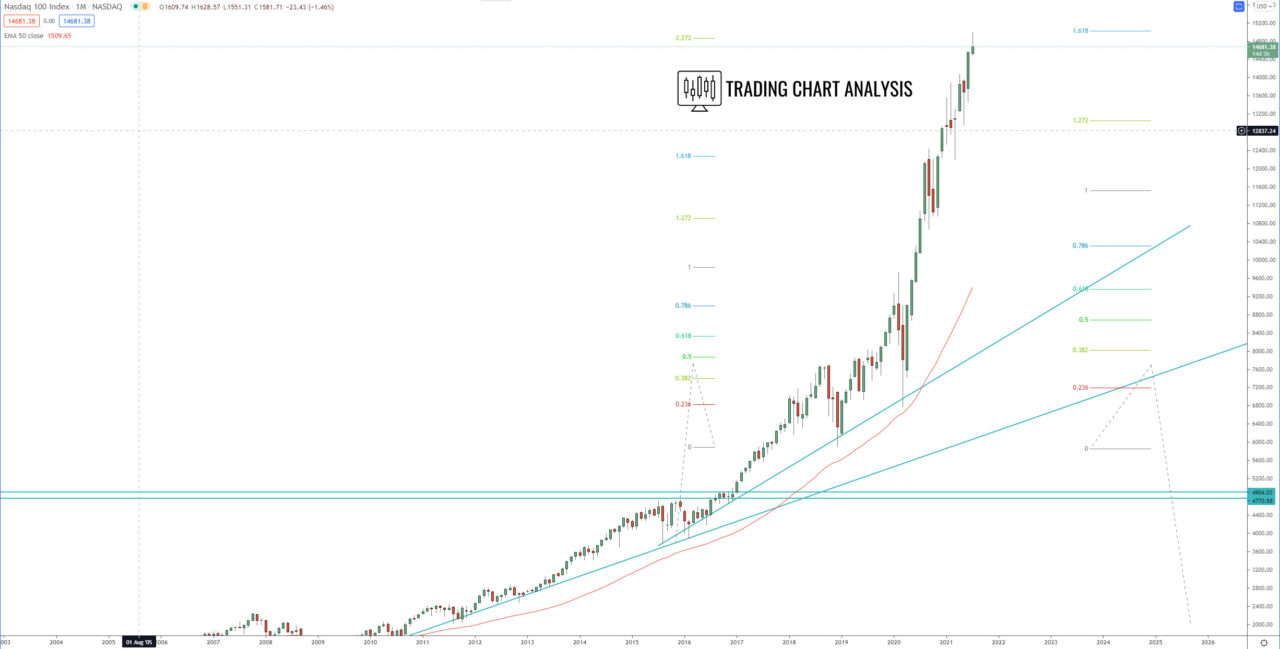
NASDAQ 100 technical analysis, the index reached our target for 2021, which was the target for the fifth bullish wave on the quarterly chart. Depending on how you count the waves on the monthly and the quarterly chart, the target was the range between 14 350 – 14 870, which is the 1.272 FIB extension and 2.272 FIB extension on the quarterly chart. For more details, you can read our technical analysis post for our 2021 target, which we posted at the beginning of January 2021.
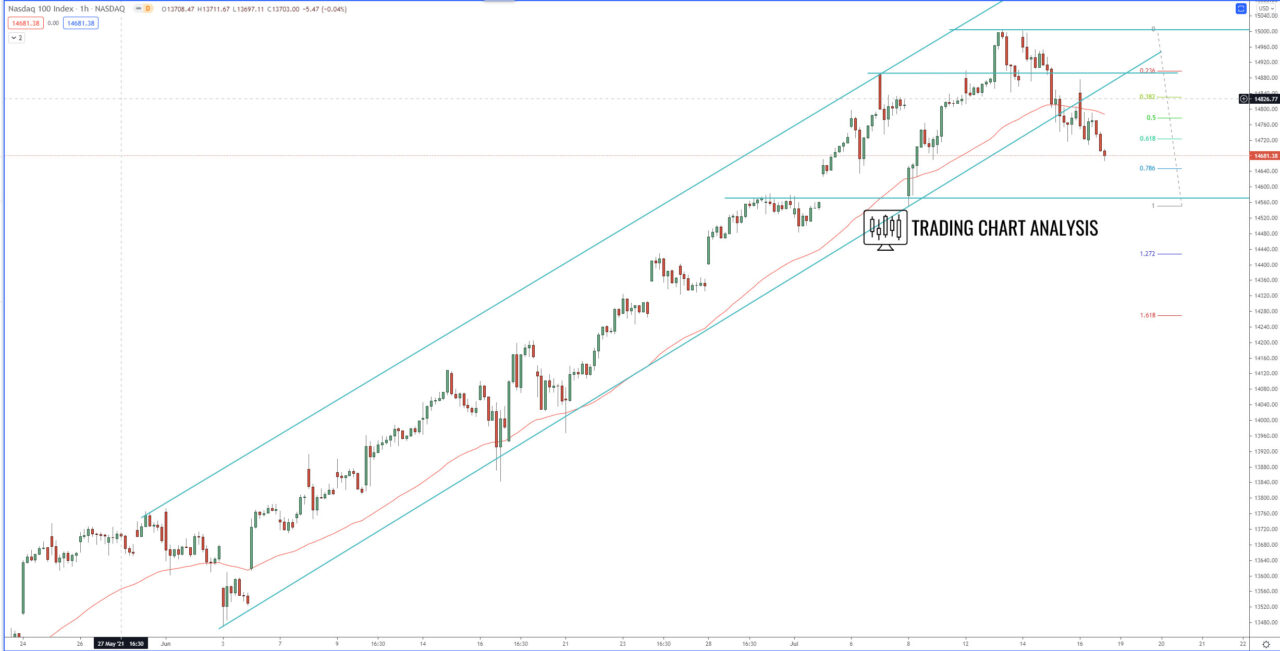
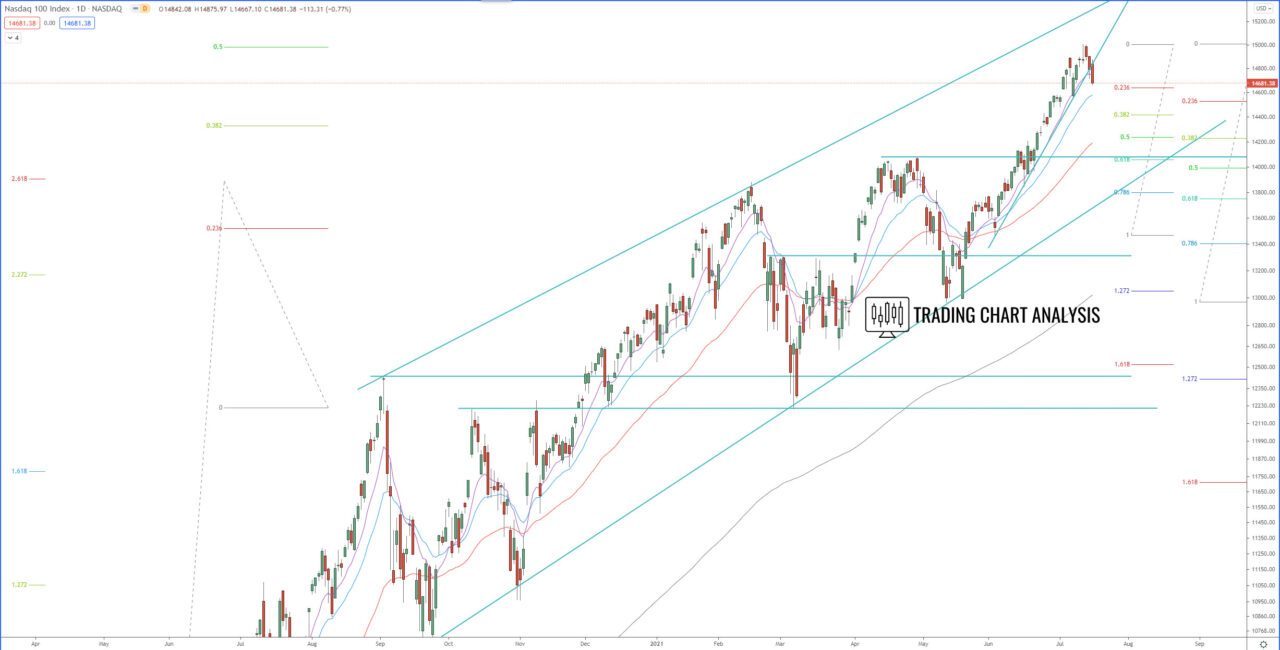
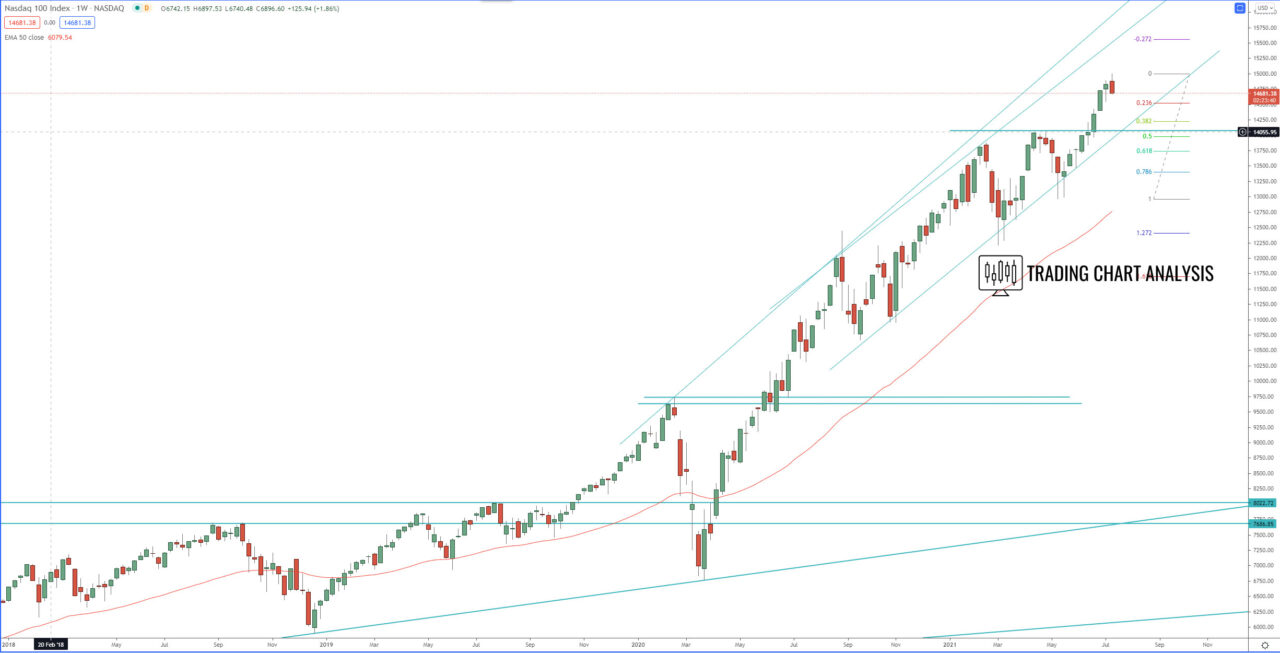
On the daily chart, the NASDAQ index reached the fourth target of the third bullish wave at 2.618 FIB extension in February and started a -12% correction. Since then, the index broke out and started the fifth bullish wave on the daily chart reaching the 0.500 FIB extension at 15 000. Now the index broke ascending price channel on the 1H chart and started a retracement on the daily and the weekly charts. The first target for this retracement is at 0.386 FIB retracement on the daily chart at 14 420, the second target is the 0.386 FIB retracement on the weekly chart at 14 220, and the third target is the support and the 0.618FIB retracement on the daily chart at 14 060.
If the NASDAQ 100 breaks above 15 000, it will resume the fifth bullish daily wave and open the door for a run toward the 0.618 FIB extension at 15 630.
1H chart:

Daily chart:

Weekly chart:

Monthly chart:


