|
Getting your Trinity Audio player ready...
|
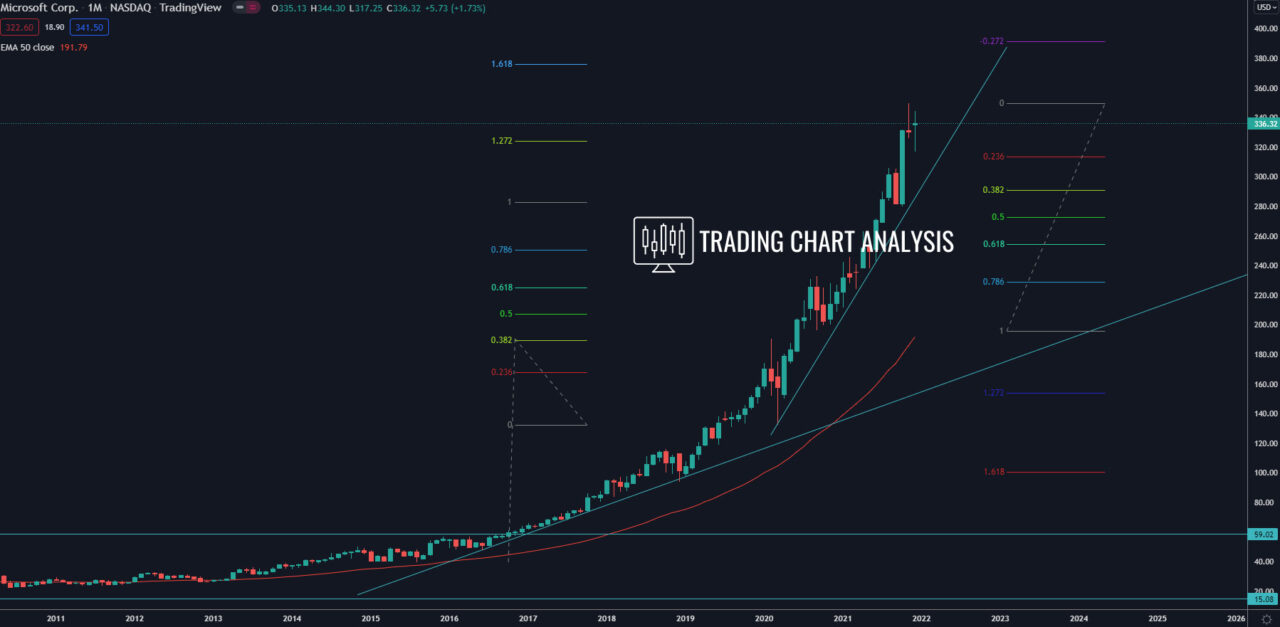
Technical analysis for Microsoft (MSFT), the shares reached the third target for the third quarterly bullish wave, the 2.272 FIB extension at 325$, which was also the third target for the fifth monthly bullish wave. Next target for the quarterly bullish wave is the 2.618 FIB extension at 360$. And the fourth target of the fifth monthly bullish wave for the shares of Microsoft (MSFT) is the 1.618 FIB extension at 375$.
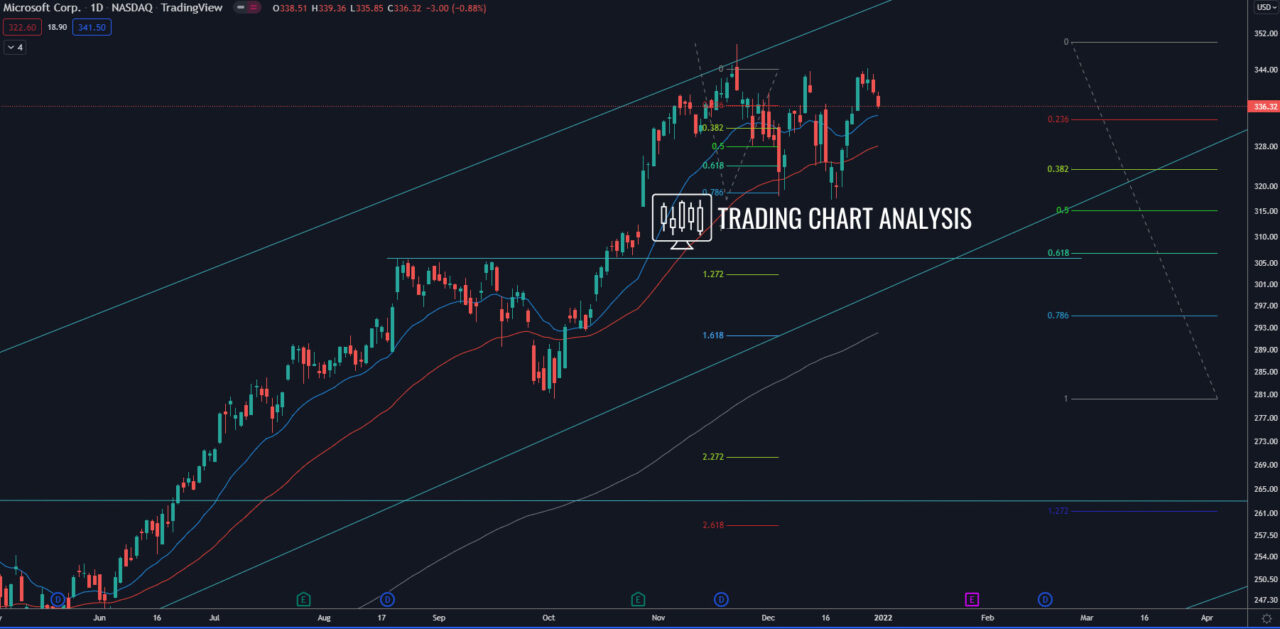
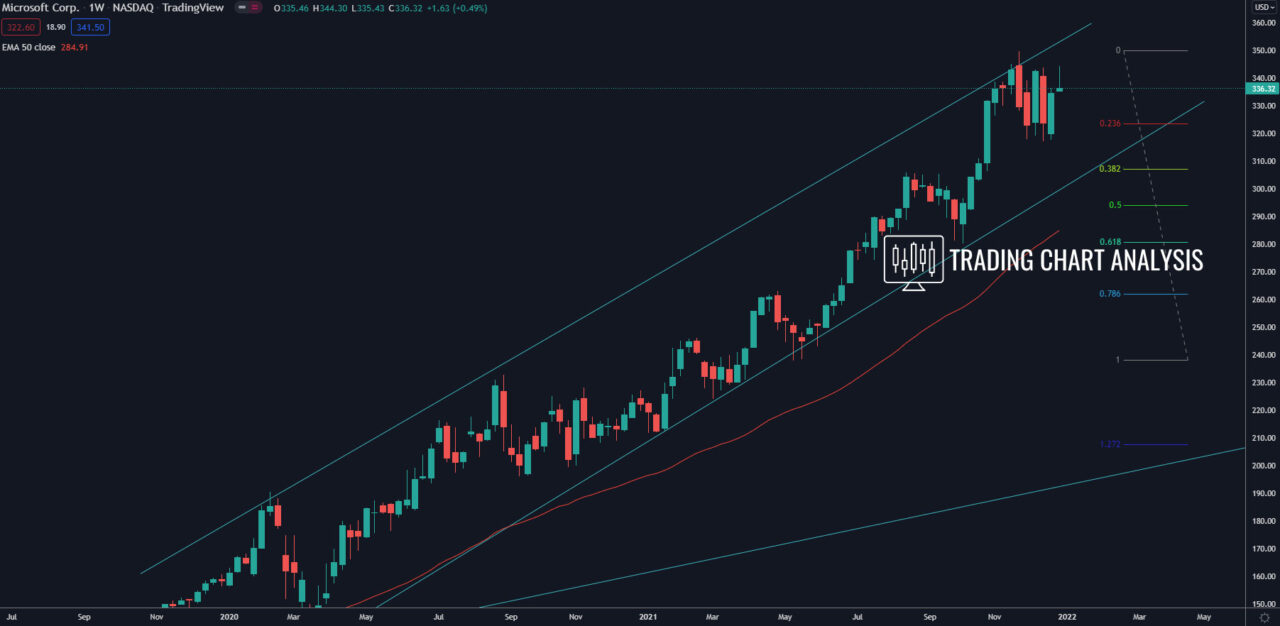
However, on the monthly chart, the shares of Microsoft (MSFT) formed a tweezers top, which is a signal for a pullback. Also, on the weekly and the daily charts, the price is consolidating, and we have RSI and MACD bearish divergence, which is another sign of weakness in the price. Therefore, if the shares of Microsoft break out of consolidation and break below the previous daily low at 317$, that will start a bearish run. The first target for this potential pullback is the 0.618 FIB retracement on the daily chart at 307$, which is a 0.382 FIB retracement on the weekly chart. A break below 307$ will open the door for a bearish run toward the 0.382 FIB on the monthly chart at 290$. And it may even push the stock of Microsoft lower, toward the 0.618 FIB retracement on the weekly chart at 280$.
Daily chart:

Weekly chart:

Monthly chart:


