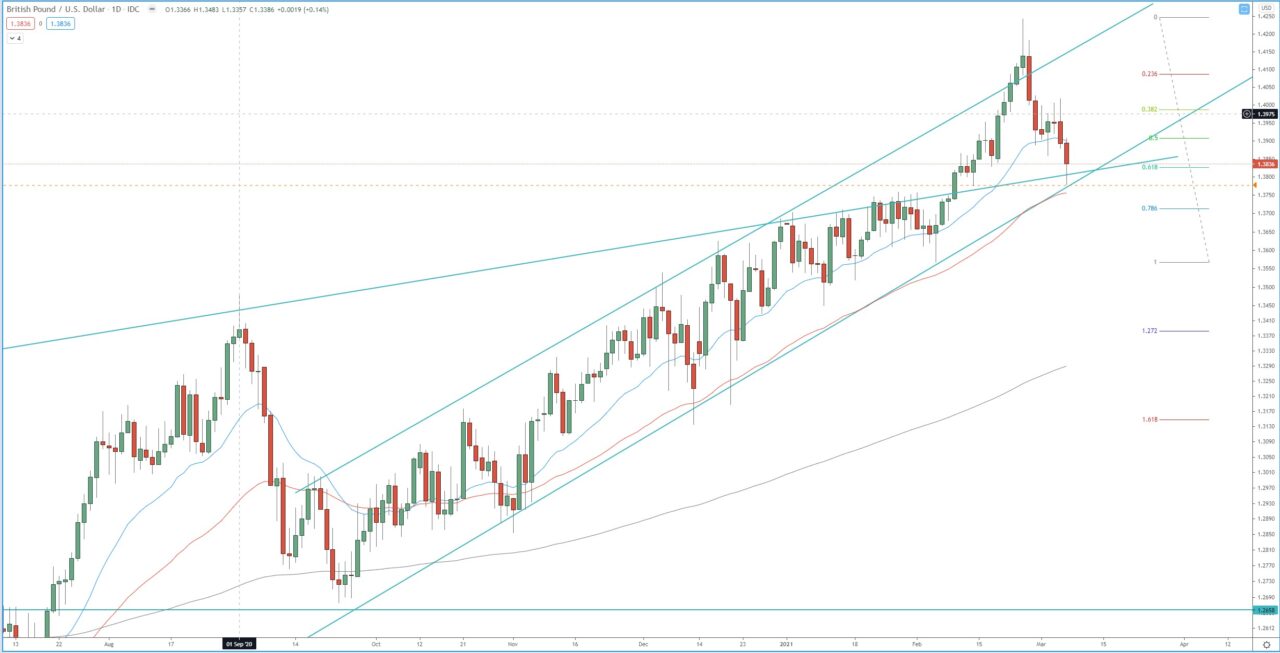
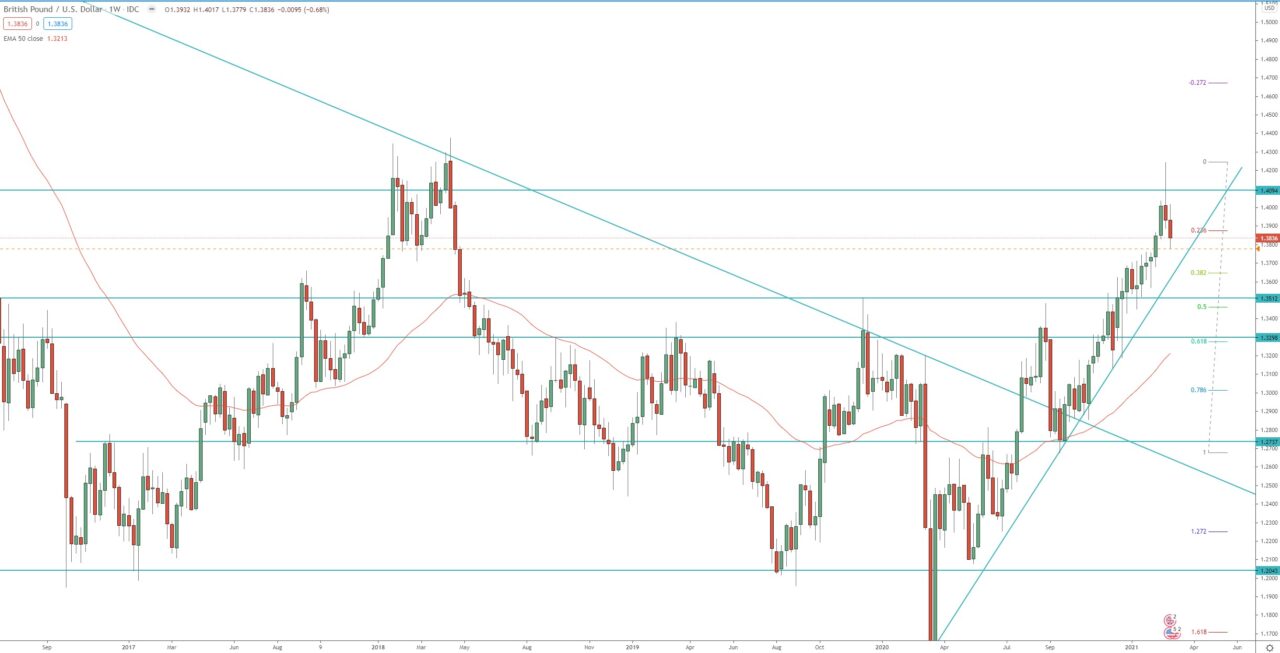
The pair reached the first target of the weekly bullish wave at 1.272 FIB extension around 1.4040, formed a high-test candle on the weekly chart, and started a pullback. This pullback is forming as a ABC pullback on the daily chart and reached both horizontal and dynamic support around 1.3770. If the price break below last week low at 1.3775, and the dynamic support around 1.3750, further decline is expected toward, first around 1.3650 (which is 0.386 FIB retracement for the last weekly run, and 100% FIB extension for the 4H bearish run), second toward 1.272 FIB extension around 1.3550.
On the other hand, if the price break above last week high at 1.4017, it will resume the daily bullish trend and send the price toward the previous high at 1.4240, and then toward the 1.618 FIB extension for the weekly bullish wave around 1.4525!
Review our technical analysis for GBP/USD pair for 2021 targets.
Daily chart:

Weekly chart:


