|
Getting your Trinity Audio player ready...
|
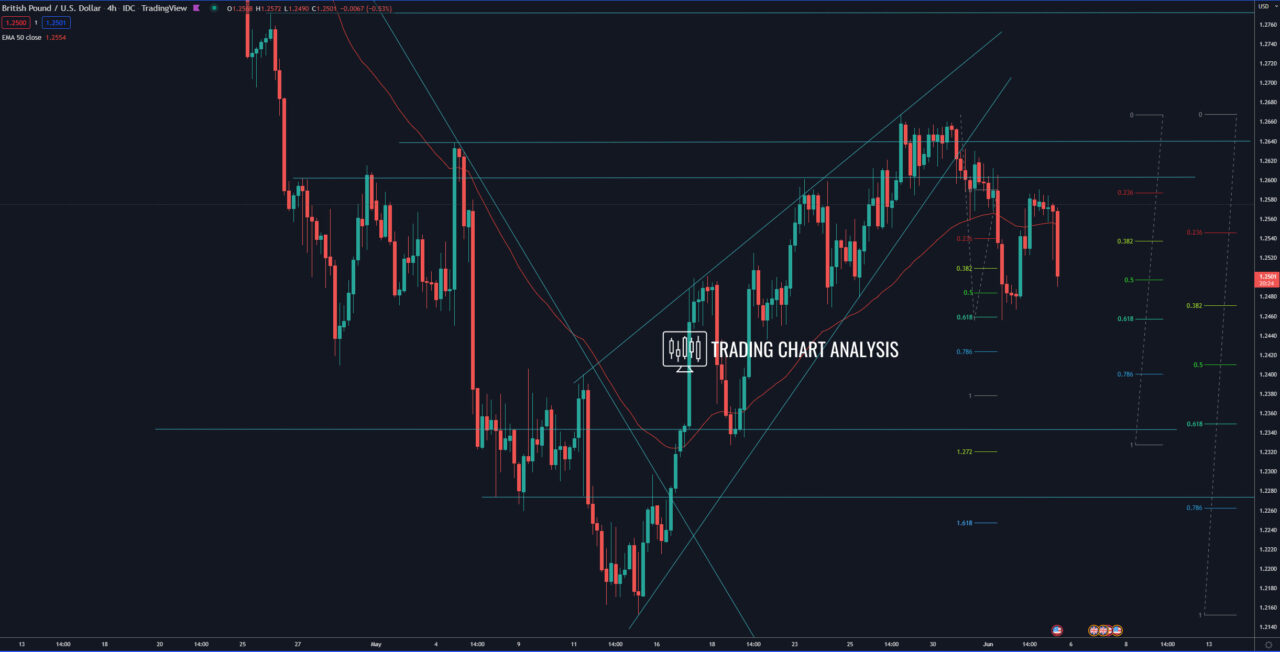
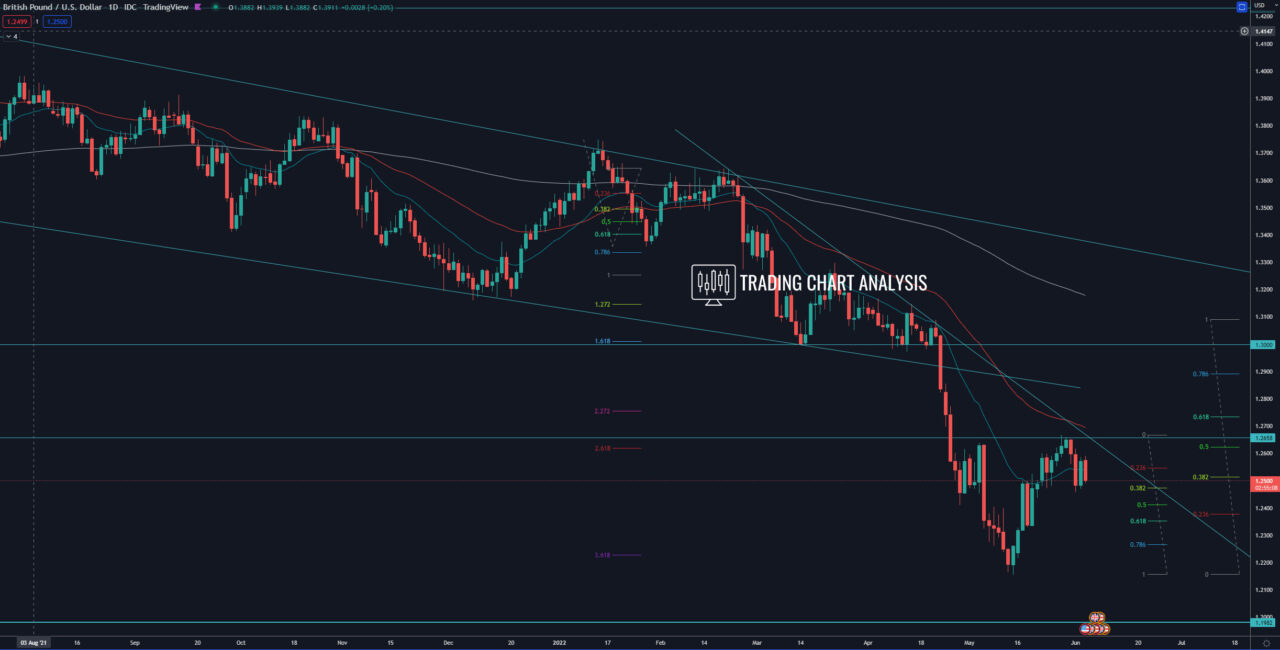
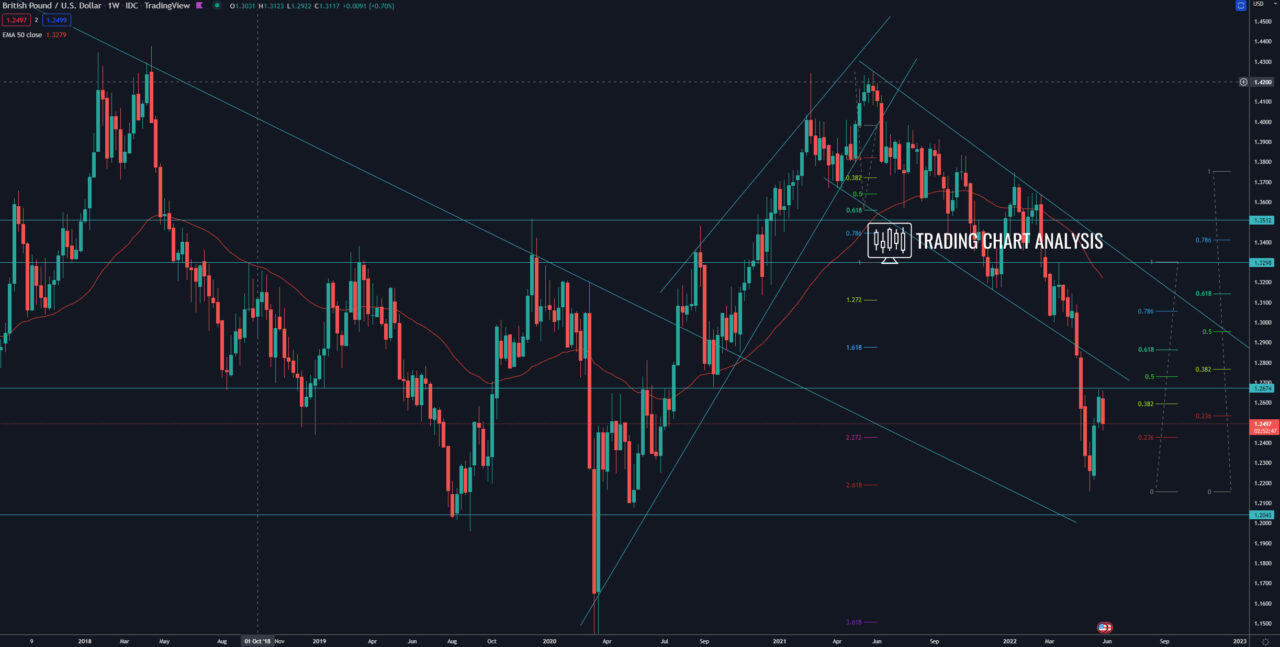
Technical analysis for GBP/USD, the pair reached the previous daily high and the 0.382 FIB retracement on the weekly chart at 1.2600 and formed a Head & Shoulders pattern on the four-hour chart, which is a sign of resumption of the bearish trend. If the GBP/USD breaks below the low at 1.2456 and below the neckline of the Head & Shoulders on the four-hour chart, it will send the price lower toward the 0.618 FIB retracement on the daily chart at 1.2350, where we have the 1.272 FIB extension on the four-hour chart and support. The second target for this potential bearish breakout is the 1.618 FIB extension on the four-hour chart at 1.2250, where we have the 0.786 FIB retracement on the daily chart. The fourth target for the GPB/USD is the previous weekly low at 1.2153.
If the GBP/USD breaks below the previous low on the weekly chart at 1.2150, that will open the door for a bearish run toward the 1.618 FIB extension on the monthly chart at 1.2000.
On the other hand, if the GBP/USD breaks above the resistance at 1.2667, and above the descending trend line on the daily chart, it will open the door for a bullish run toward the 0.618 FIB retracement on the weekly chart at 1.2865.
Four-hour chart:

Daily chart:

Weekly chart:


