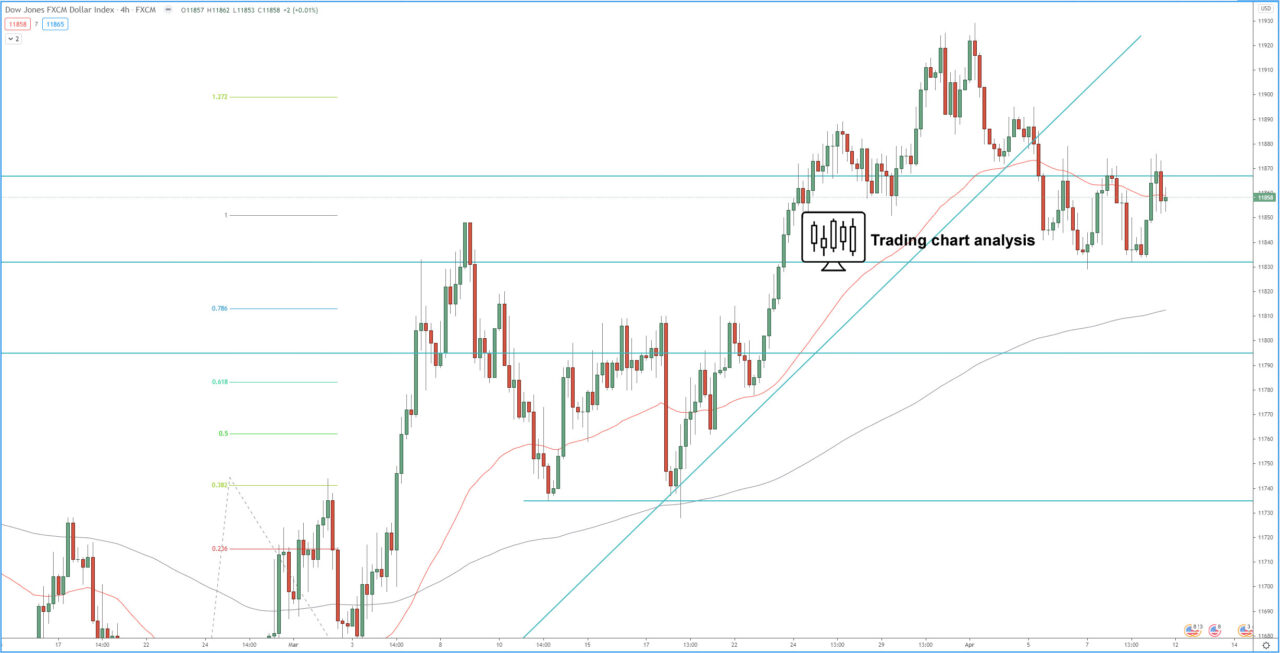
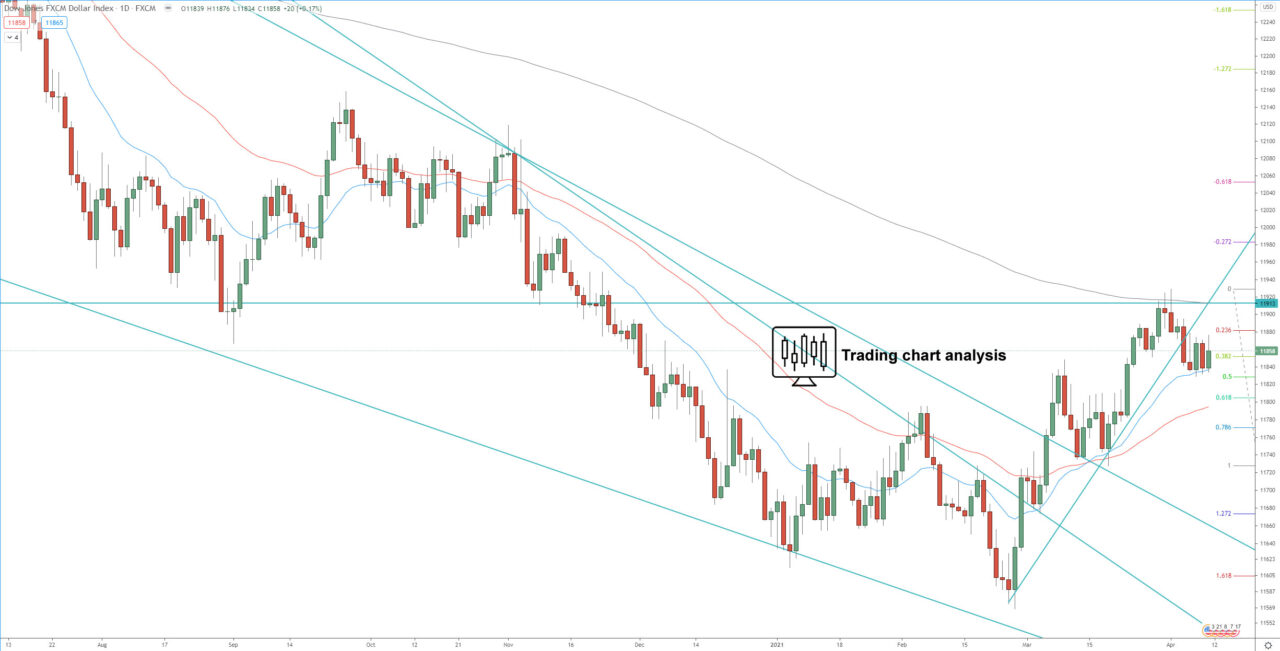
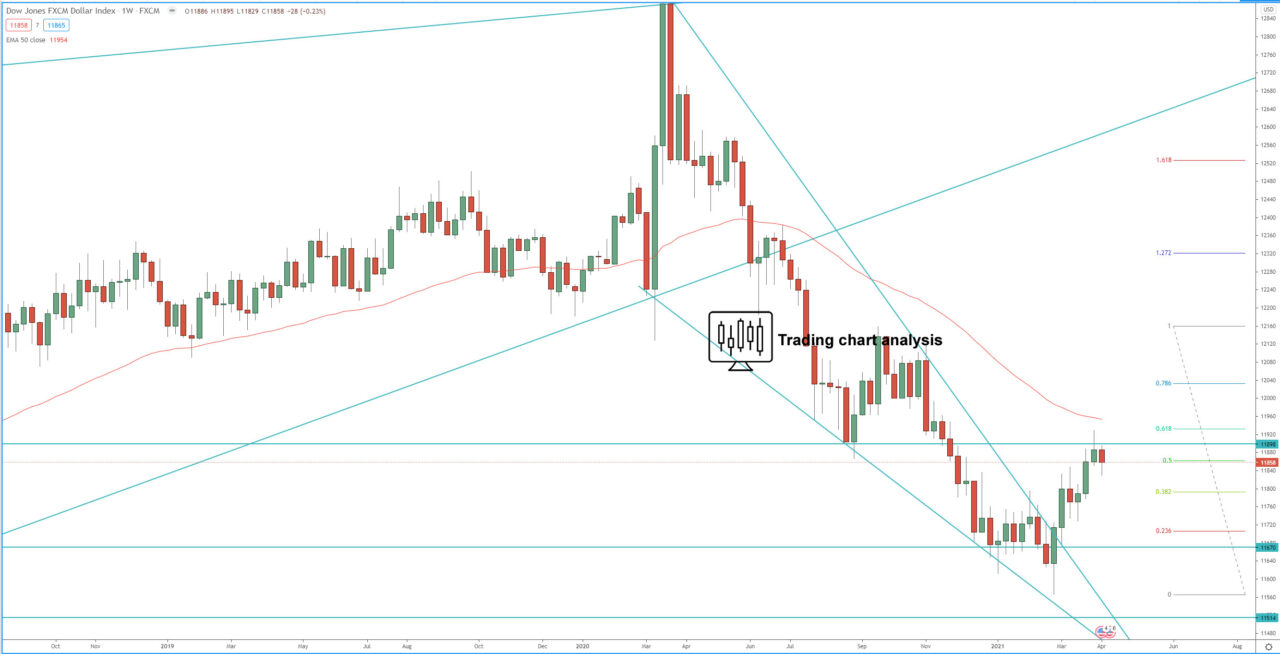
Technical analysis for the FXMC dollar index is showing that on the weekly chart the index formed tweezers top a signal for potential resumption of the weekly bearish trend. The focus in the week ahead is on the previous week’s low at 11 829, if the price break below it, it will accelerate the decline towards 0.618 FIB retracement at 11 800. Breaks below 11 800 will extend the decline toward 1.272 FIB extension at 11 765, and second toward 1.618 FIB extension at 11 735.
On the other hand, if the FXCM dollar index breaks above 11 880 will send the price toward the previous high at 11 925. If the price breaks above 11 925 will extend the daily bullish run toward 1.618 FIB extension at 11 925 and open the door for a bullish run toward 12 080.
Review our technical analysis for the FXCM dollar index for our 2021 targets.
4H chart:

Daily chart:

Weekly chart:


