|
Getting your Trinity Audio player ready...
|
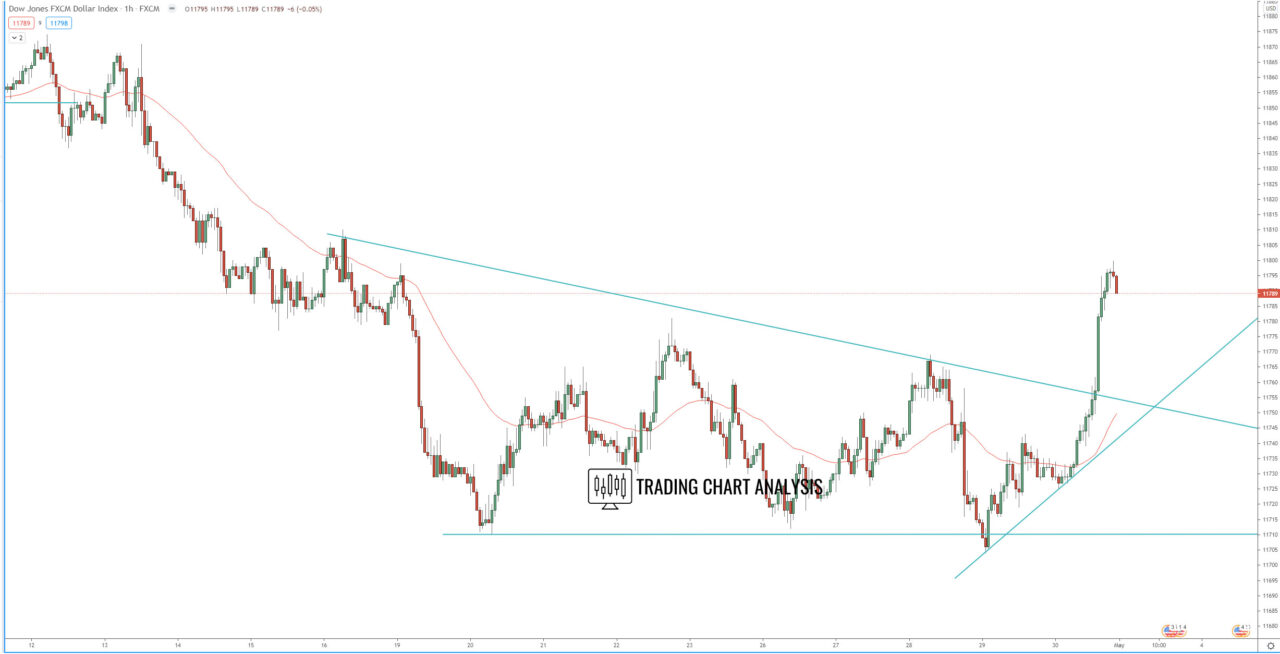
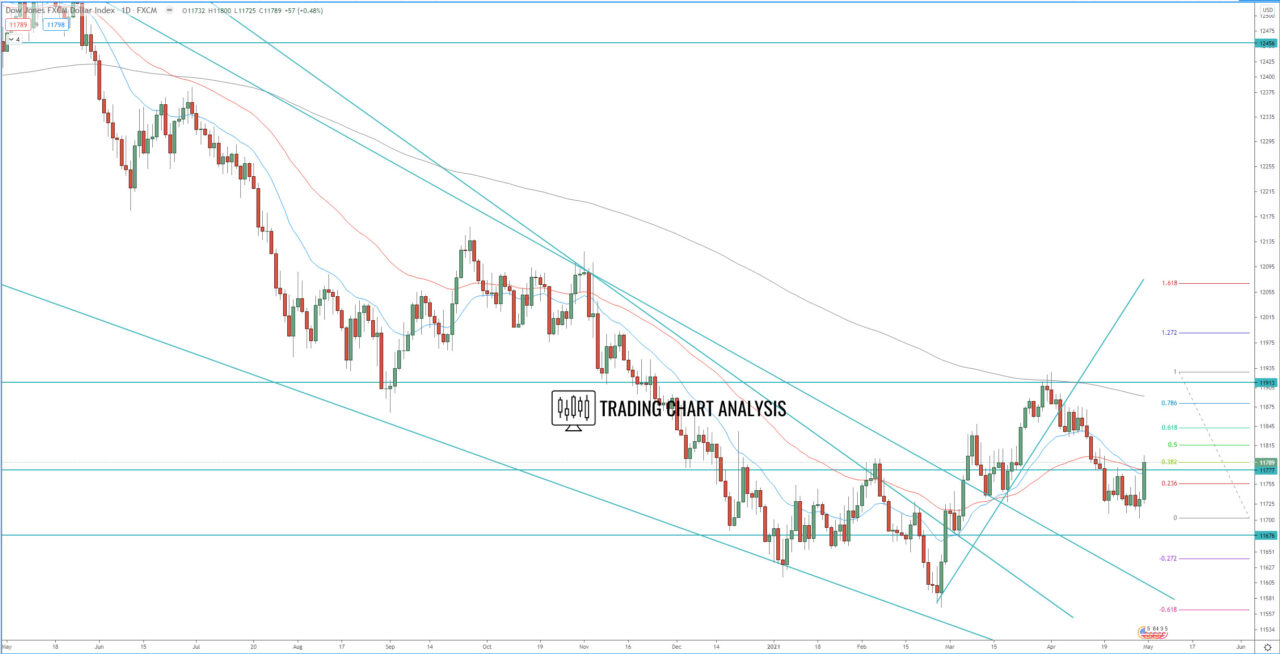
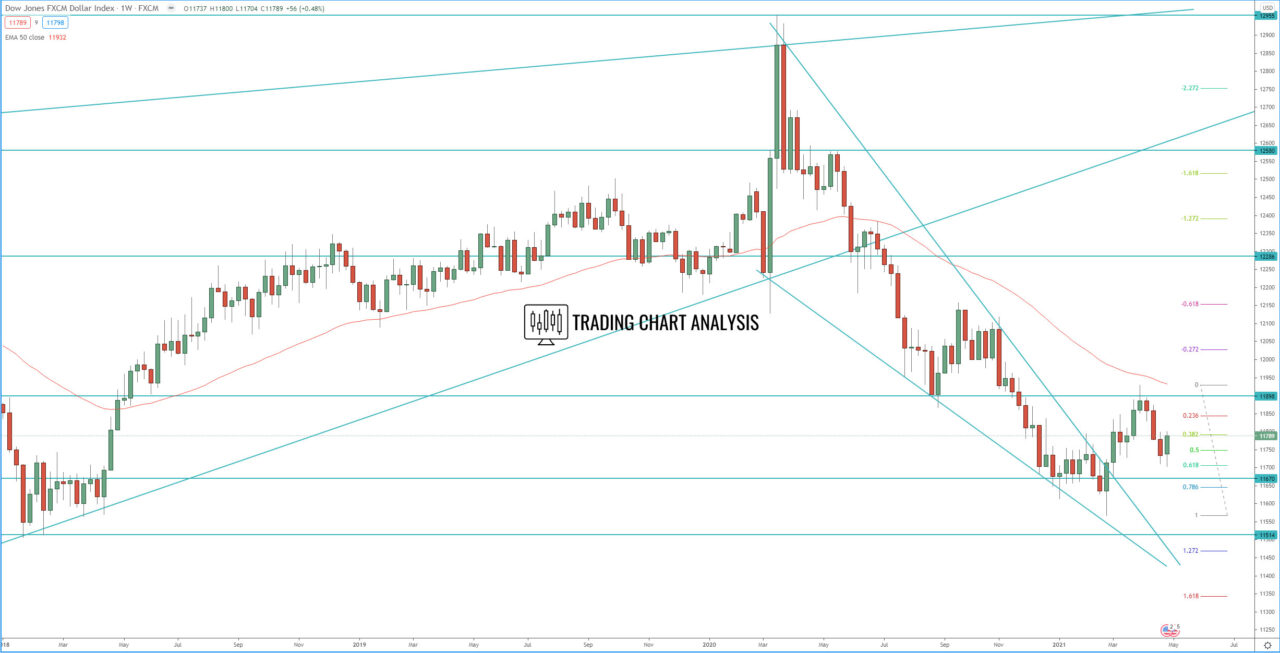
Technical analysis for the FXCM dollar index is showing, that the index bounced from the 0.618 FIB retracement, closing the week with a bullish engulfing candle on the weekly chart. This bullish engulfing on the weekly chart materialize as a breakout of consolidation on the daily chart, breakout of descending triangle on the 1H chart. The first target of this breakout on the 1H chart was reached at 11 800, the second target is the 0.618 FIB retracement at 11 840. If the FXCM dollar index break above 11 850 it will be a signal for further upside toward the previous high at 11 929.
Focus for the week ahead is on last week’s low at 11 704, if the FXCM dollar index breaks below it, it will be a signal for further downside potential toward the previous weekly low at 11 567.
1H chart:

Daily chart:

Weekly chart:

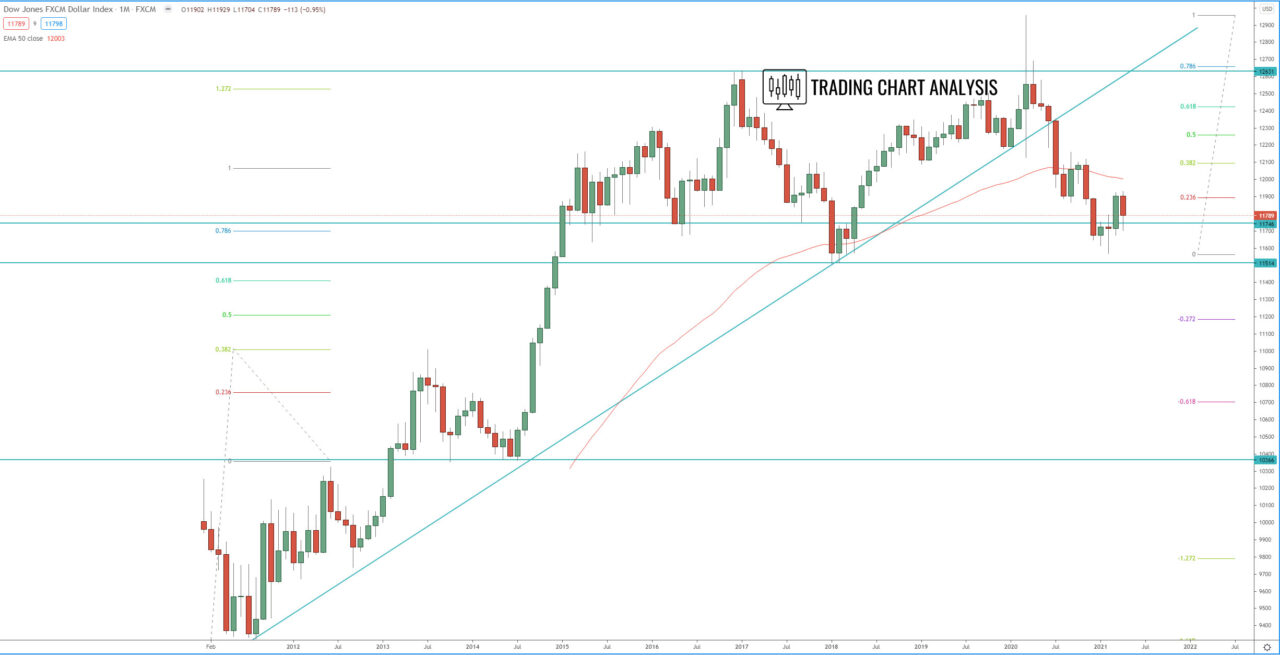
Monthly chart:


