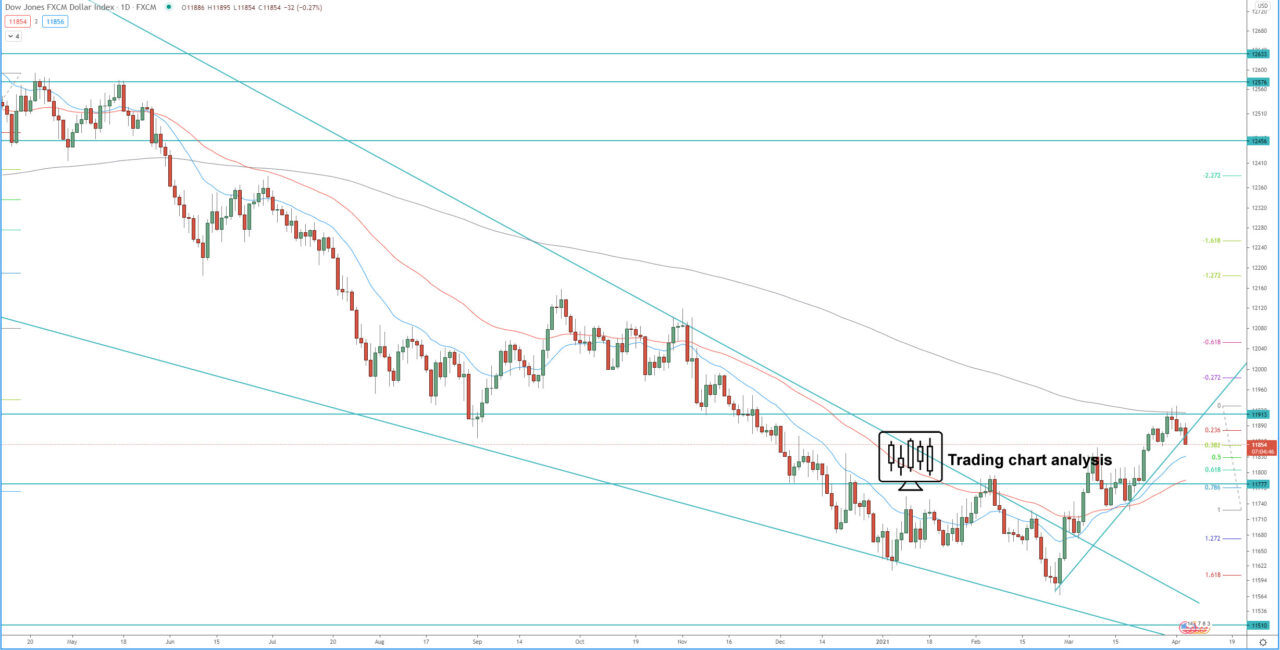
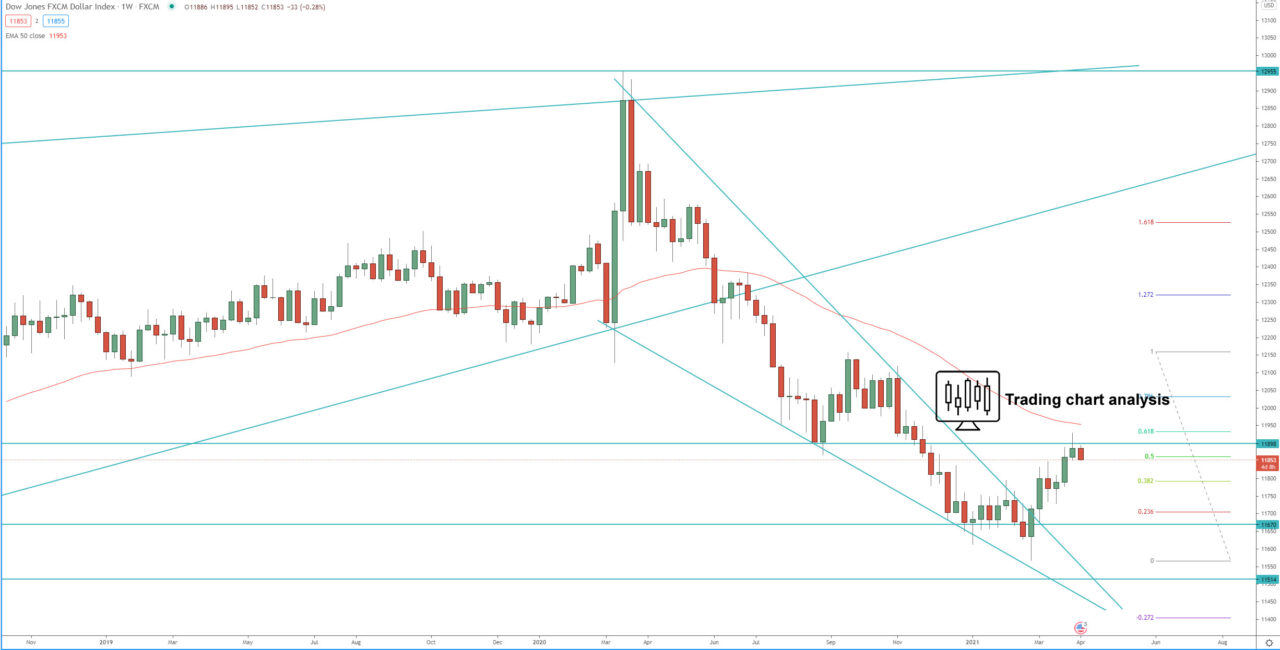
Technical analysis for the FXCM dollar index is showing that the price is still within the daily bullish run, but it reached a resistance around 11 910 – 11 915. If the index break above last week high, it will extend the bullish run toward, first at 11 960, which is the 1.618 FIB of the bullish wave on the 4H chart, and second, at 100% FIB extension of the bullish daily run at 12 000 and the third target is the 1.272 FIB extension at 12 080.
On the other hand, if the FXCM dollar index breaks below the support zone between 11 870 – 11 850, it will send the index lower toward, first the 11 820, and second that 11 800, which is the 0.618 FIB retracement.
Daily chart:

Weekly chart:


