technical analysis – 7 – 13 February 2021
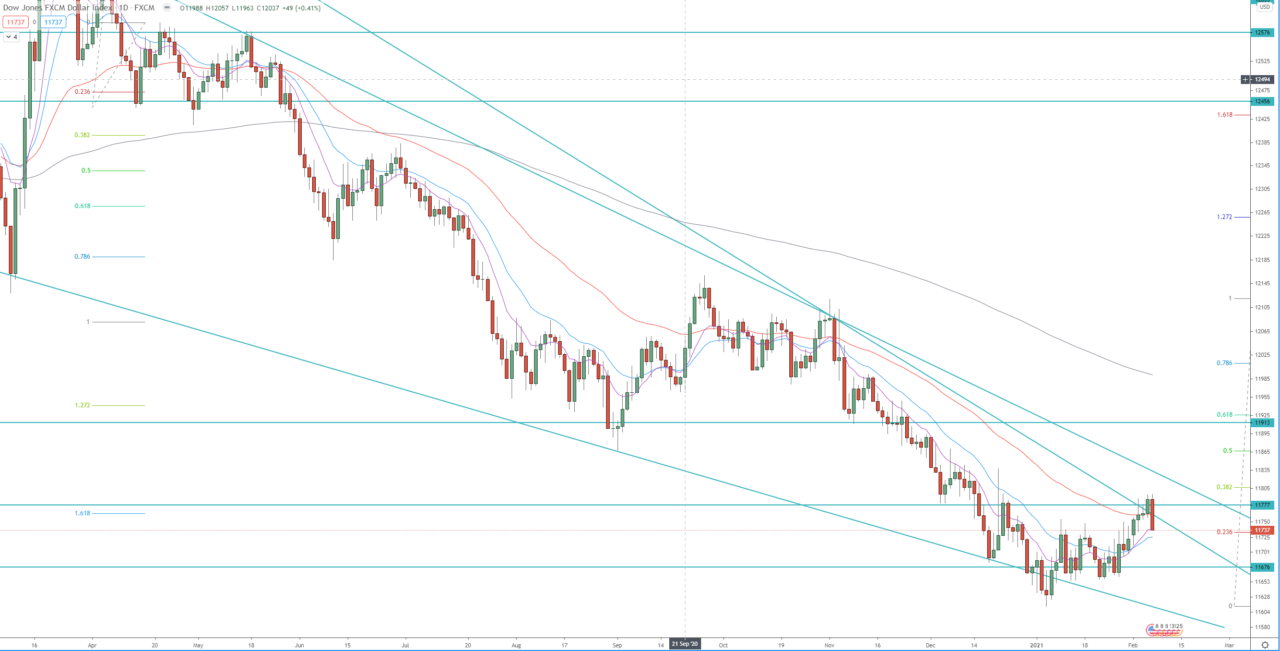
It was an interesting week for the USD, we witnessed break out of a range, to the upside, on the 4H and the daily charts, but that break out, resulted in a false break out, rejection on the weekly chart and perhaps concluding the ABC pullback on the daily chart.
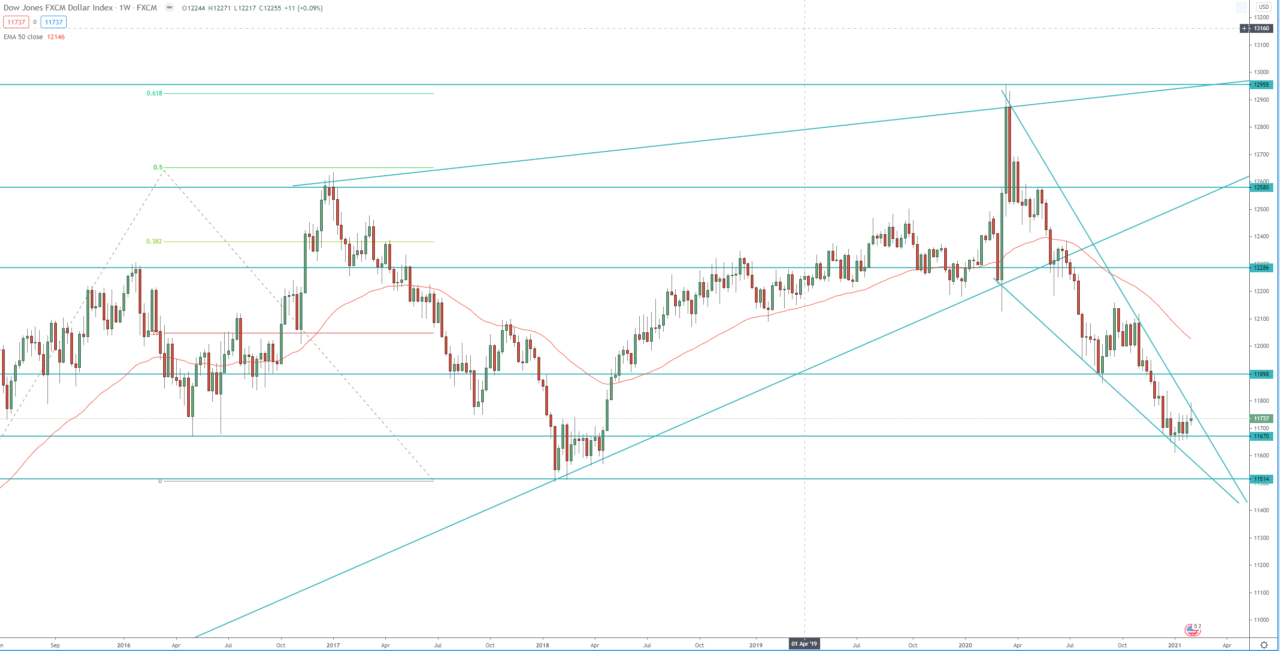
The weekly chart is still within its 3rd bearish wave, the first target of that wave is at 1.272 FIB extension around 11 400. Before that, we have the 2018 low around 11 515 as support. Last week, the weekly chart closed with high test candle rejection horizontal resistance and dynamic resistance.
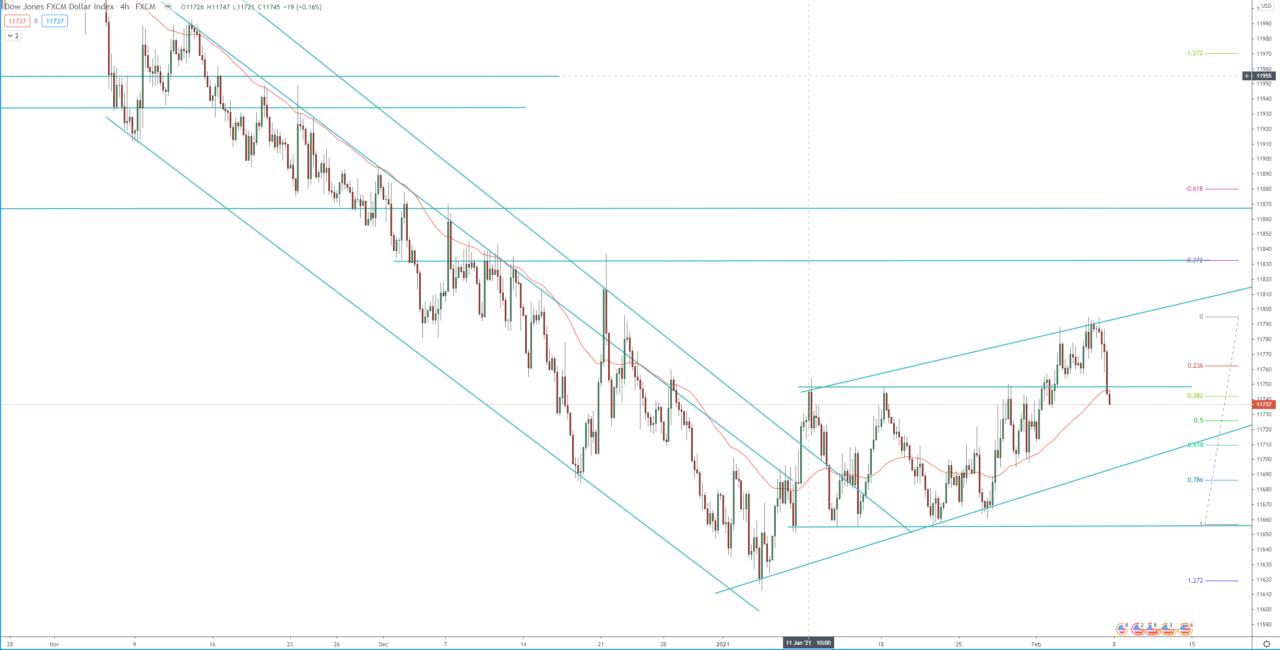
This coming week the focus is on the bearish flag on the 4H chart. If we see a breakdown, that will be a signal for the resumption of the bearish trend on the 4H and the daily charts. If indeed the break down materializes, the first target is the previous daily lows around 11 615, the second target is the 2018 low around 11 515 and the third is the 1.272 FIB extension of the 3rd weekly bearish trend around 11 400.
On the other hand, if we see a break above the previous weekly high, above 11 795, that will be a break out on the daily chart, above the descending wedge, and will resume the weekly pullback and the 4H bullish run. The first target of that run is the 1.272 FIB extension around 11 835, the second target is at 1.618 FIB extension around 11 880.
Weekly chart:

Daily chart:

4H chart:


