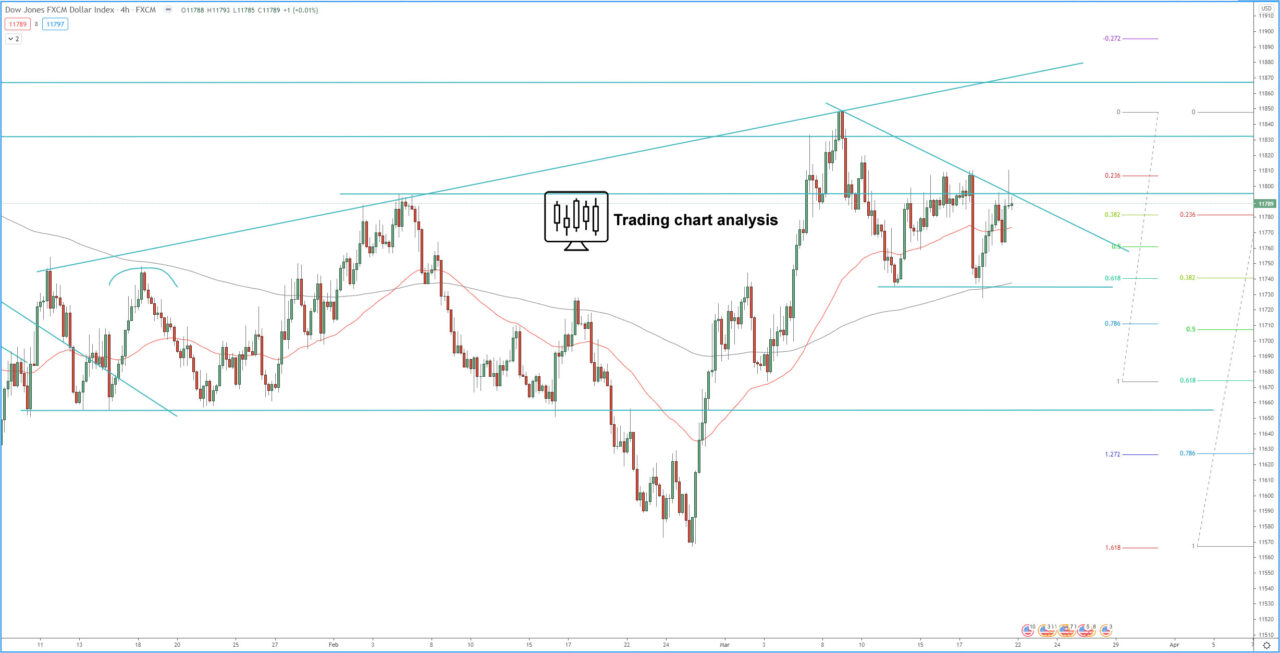
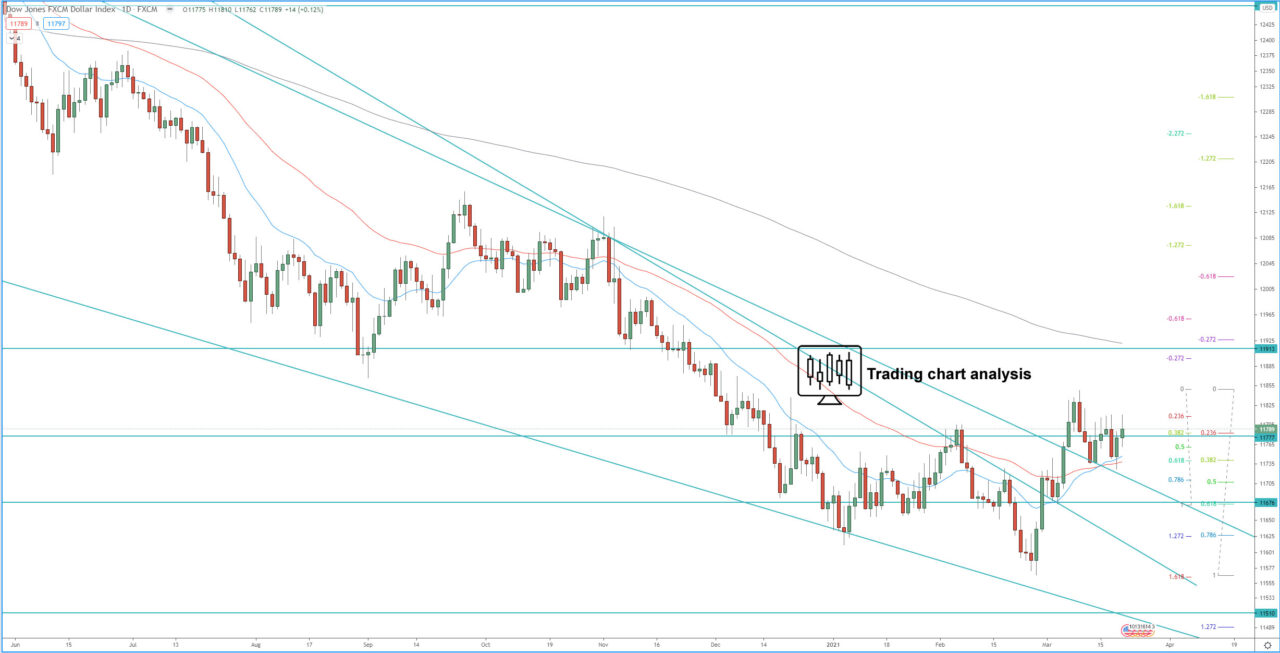
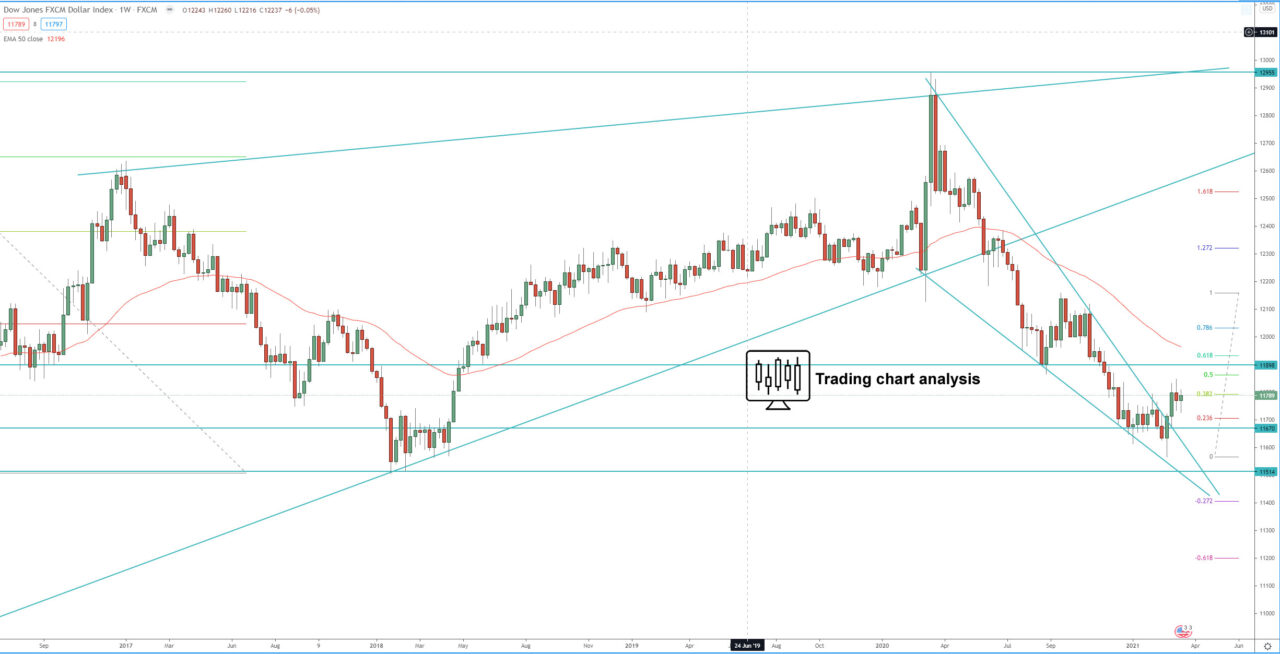
Technical analysis for the FXCM dollar index is showing that the price is trading in a range and form a descending triangle on the 4H chart. Break above the descending triangle will resume the bullish trend on the 4H chart, towards first the previous high at 11 848, and second toward 1.272 FIB extension at 11 900 and eventually toward 1.618 FIB extension around 11 960. If we see a break below the triangle, that will send the price toward 11 675, which is a level, that we should watch, because if the index breaks below it, it will resume the bearish trend and send the price back to the previous low at 11 567 and after that toward the 2018 low at 11 500.
4H chart:

Daily chart:

Weekly chart:


