|
Getting your Trinity Audio player ready...
|
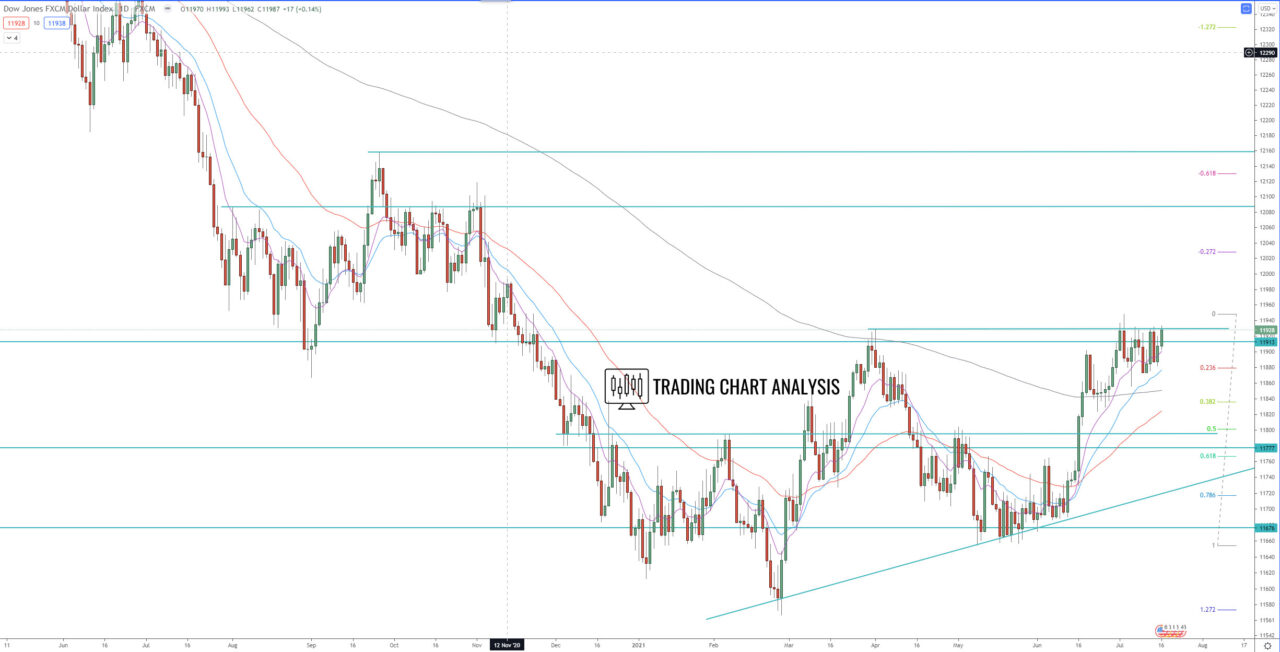
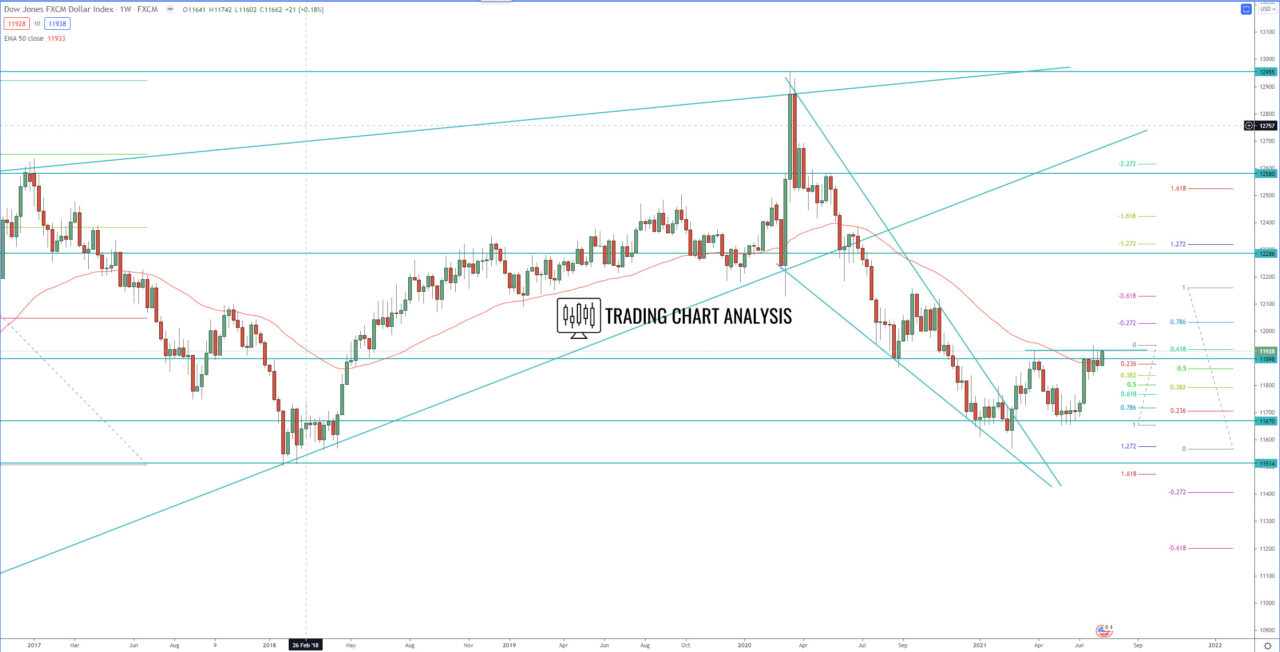
FXCM Dollar index Technical Analysis, consolidating at resistance unable to breakout decisively above the previous weekly high at 11 929. The index closed with a bullish engulfing candle, closing above the previous week’s closing candles, which is an early signal for a potential breakout ahead.
The first target for a potential breakout of the FXCM Dollar index is the 0.386 FIB retracement on the weekly chart at 12 095. The second target is the weekly high at 12 158.
If the FXCM dollar index break below 11 824, it will send the index lower toward 0.618 FIB retracement on the daily chart at 11 765.
Daily chart:

Weekly chart:

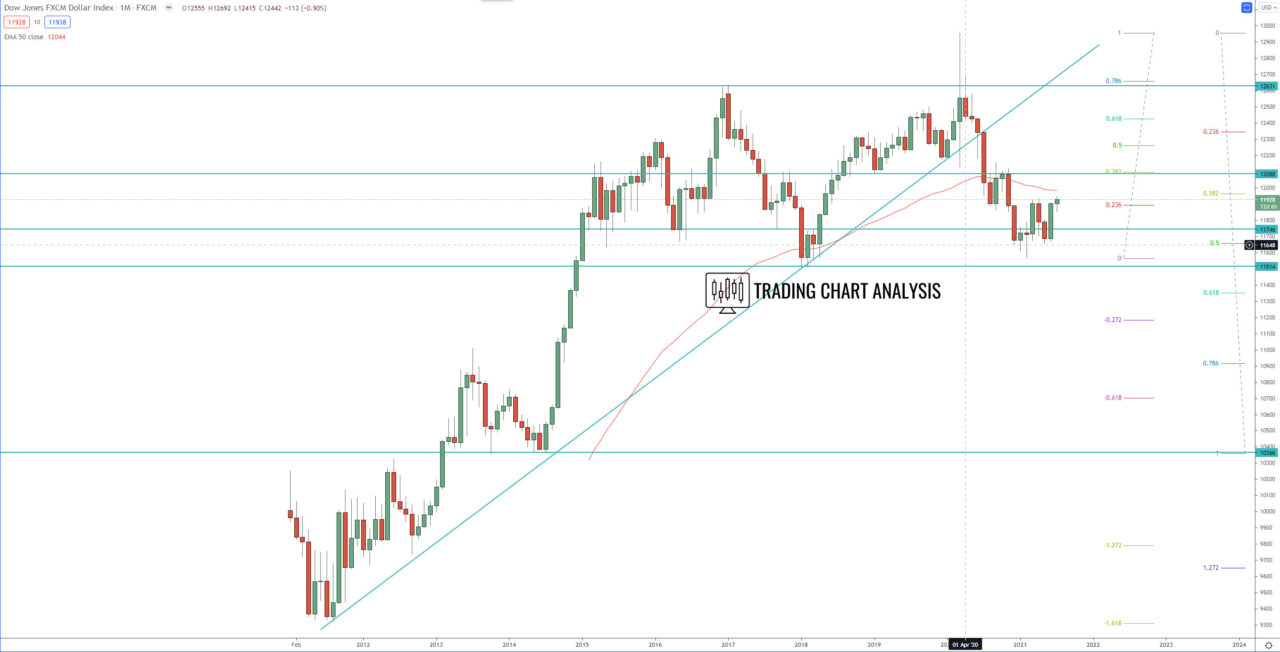
Monthly chart:


