|
Getting your Trinity Audio player ready...
|
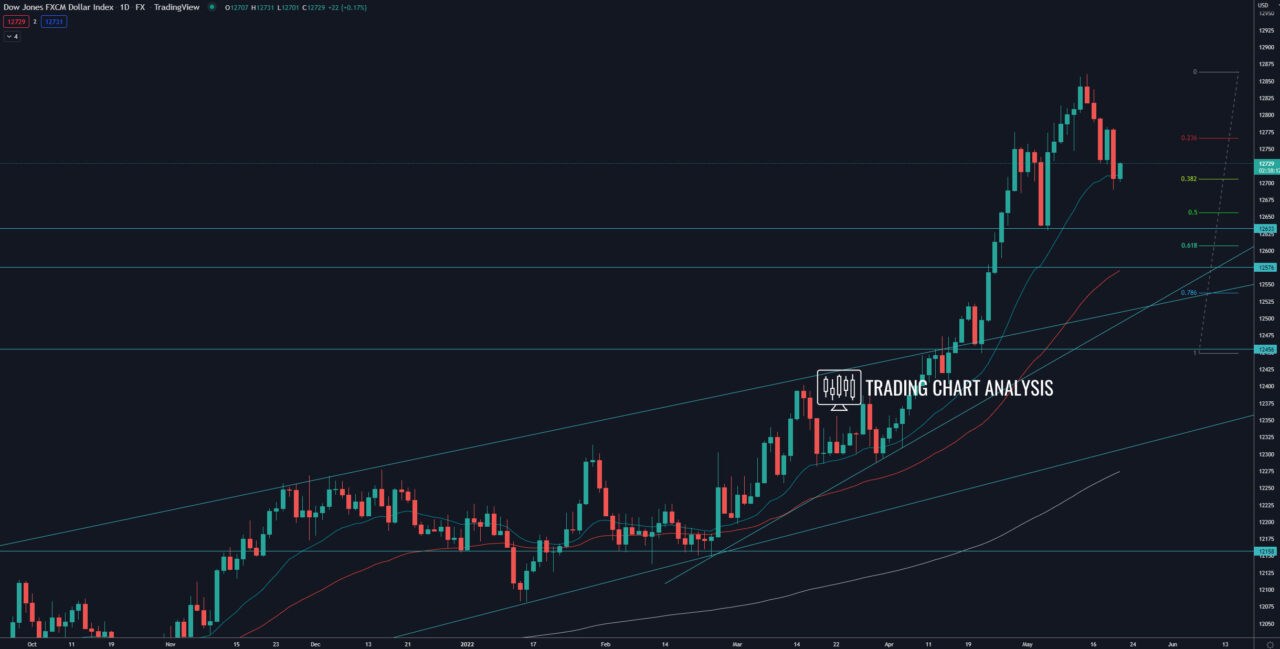
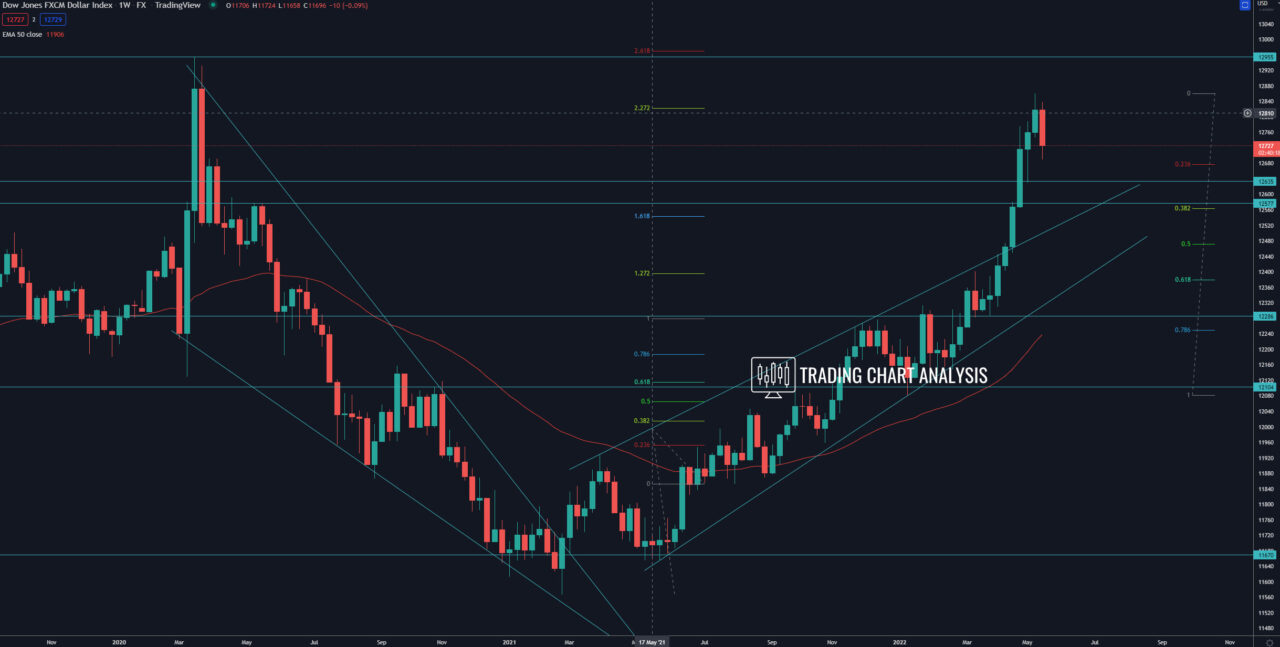
Technical analysis for FXCM dollar index, the index closed the week with a bearish engulfing candle on the weekly chart, starting a pullback. The first target for this pullback in the dollar index, the 0.382 FIB retracement on the daily chart at 12 700, was reached. The second target for the -pullback in the FXCM dollar index is the previous low on the daily chart at 12 630. The third target is the 0.382 FIB retracement on the weekly chart at 12 565.
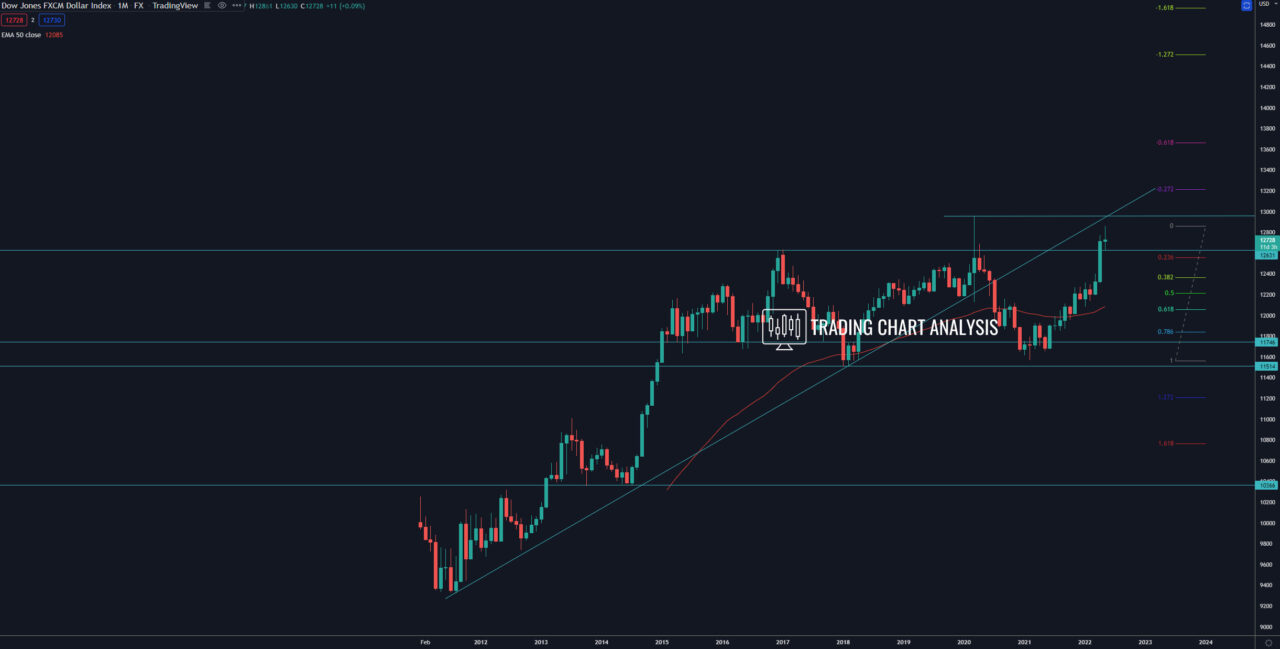
Looking at the bigger picture, the FXCM dollar index closed above the double top on the monthly chart, extending the bullish wave on the weekly chart. The fourth target for the bullish wave on the weekly chart is the 2.618 FIB extension at 12 970, just above the 2020 high at 12 955. On the monthly chart, the second target of the bullish wave on the monthly chart is the 1.618 FIB extension at 13 120.
Daily chart:

Weekly chart:

Monthly chart:


