|
Getting your Trinity Audio player ready...
|
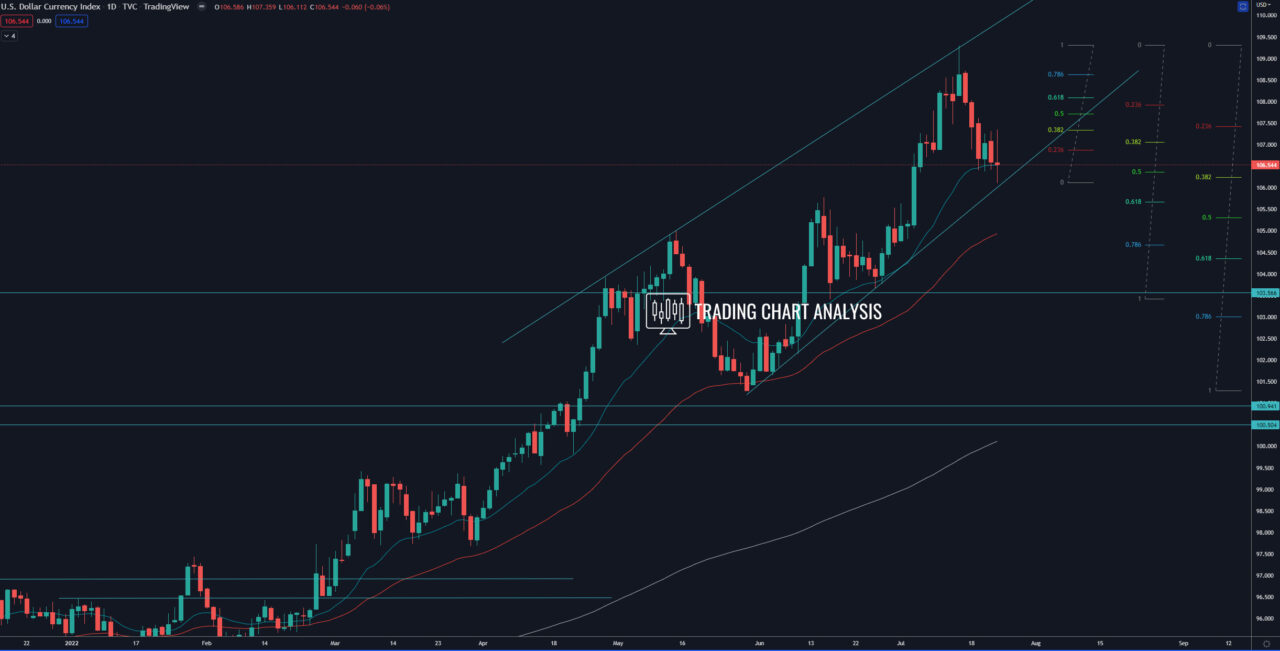
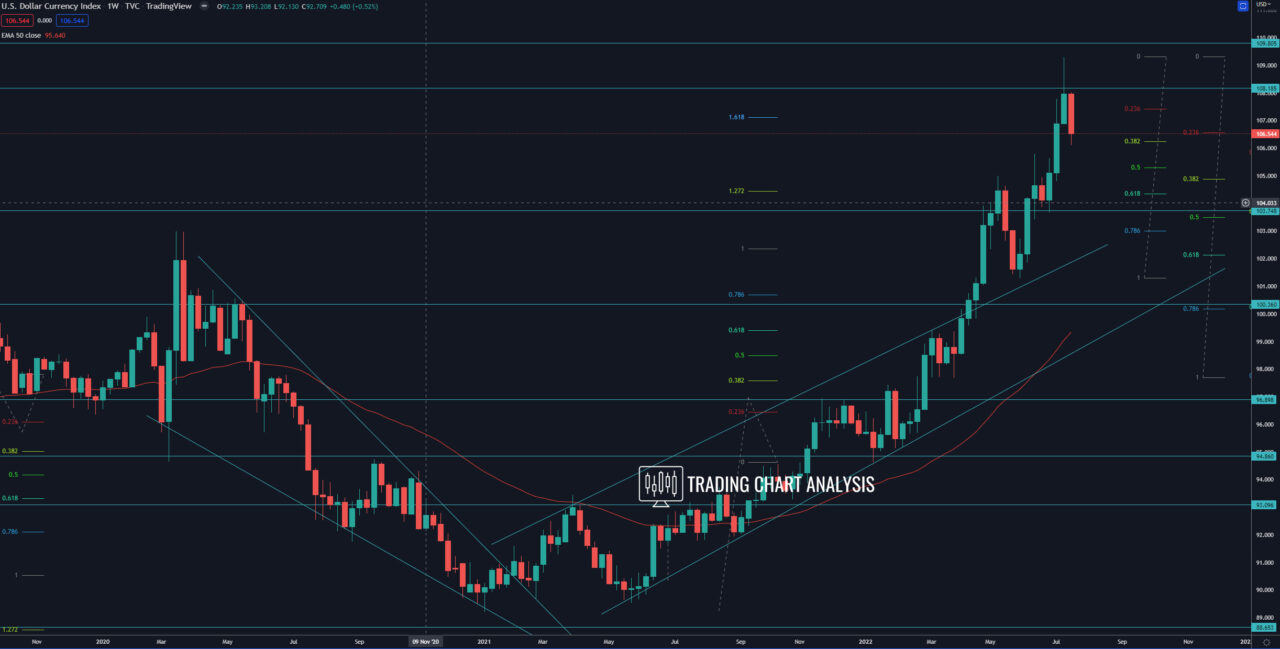
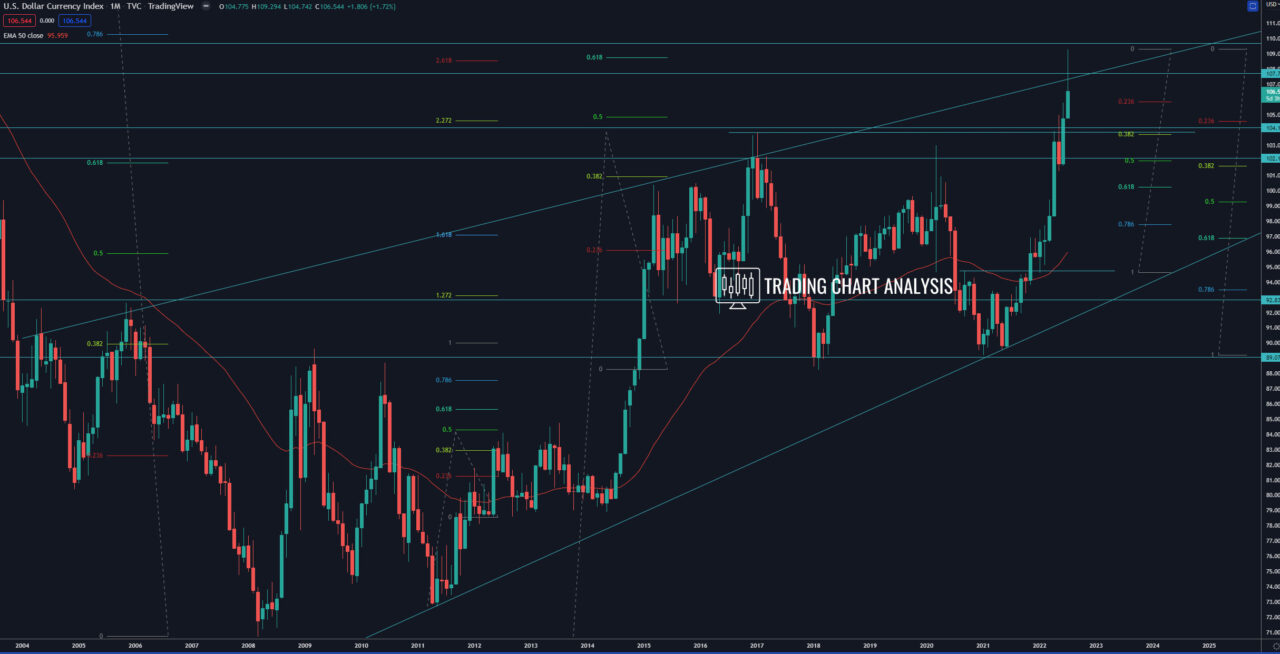
Technical analysis for the DXY dollar index, the index reached both dynamic and horizontal resistance and the 2.618 FIB extension on the monthly chart at 108.55. The dollar index went as high as 109.29 and rejected this resistance with a bearish engulfing pattern on the weekly chart, starting a pullback. The first target for this pullback, the 0.382 FIB retracement on the weekly chart at 106.26, was reached. The second target is the 0.618 FIB retracement on the weekly chart at 104.35. The third target for the pullback in the DXY index is the support and the previous low on the daily chart at 103.70.
On the other hand, keep in mind that the DXY index is sitting at the 0.382 FIB retracement on the weekly chart and at ascending trend line on the daily chart, which could be enough for a bounce and resumption of the bullish trend. Also, let’s not forget that this week is the FED interest rate hike. The Central Bank is expected to increase the interest rates by 0.75%.
The focus is on the resistance and 0.382 FIB retracement on the daily chart at 107.35, if the DXY index closes above it on the daily chart, that will push the index higher toward the 0.618 FIB retracement at 108.10. And a close above 108.10 will send the dollar index higher to retest the previous high at 109.29.
Daily chart:

Weekly chart:

Monthly chart:


