|
Getting your Trinity Audio player ready...
|
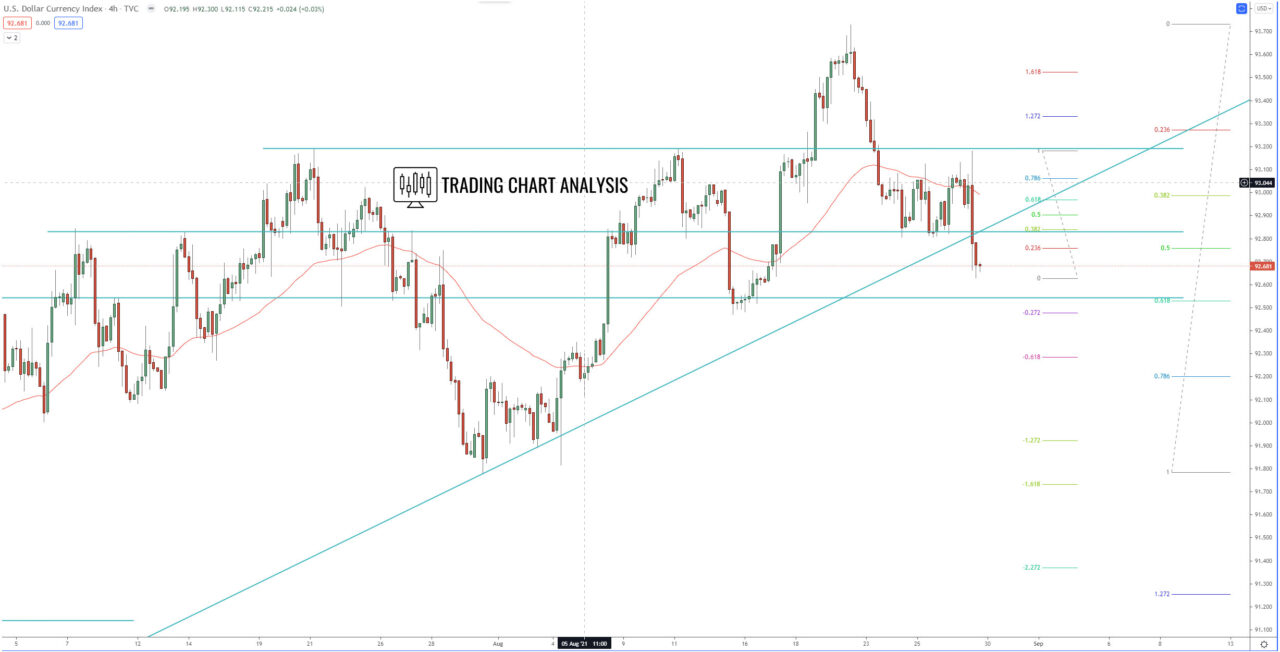
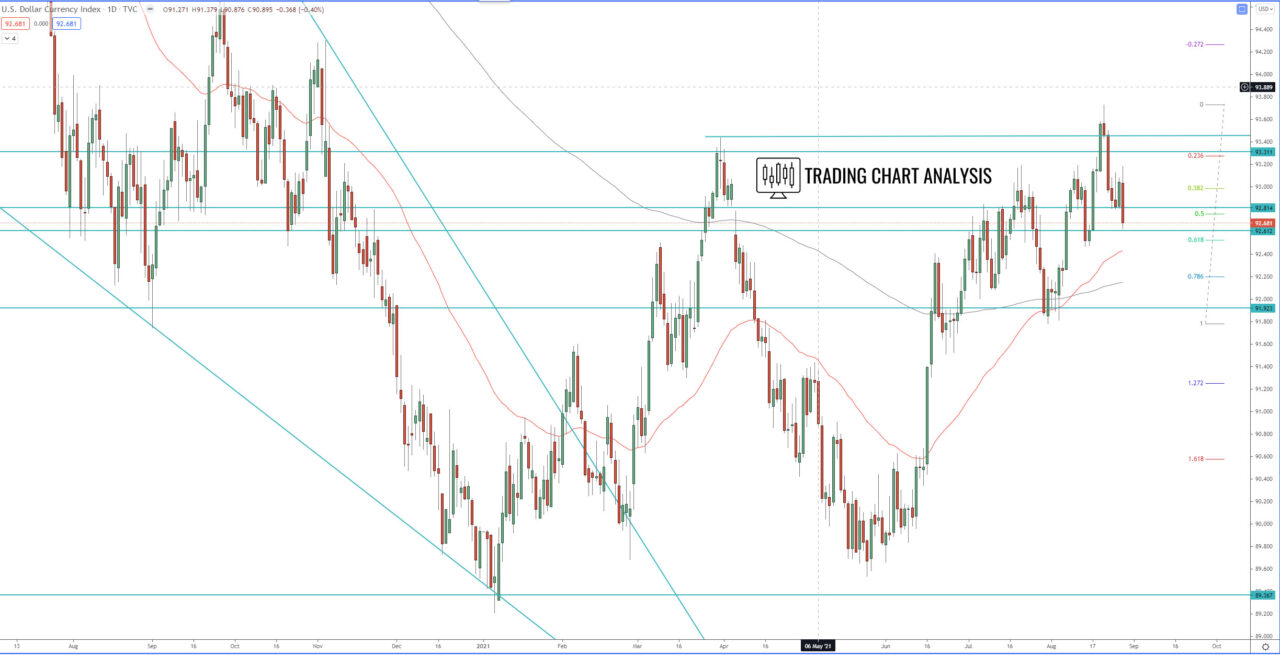
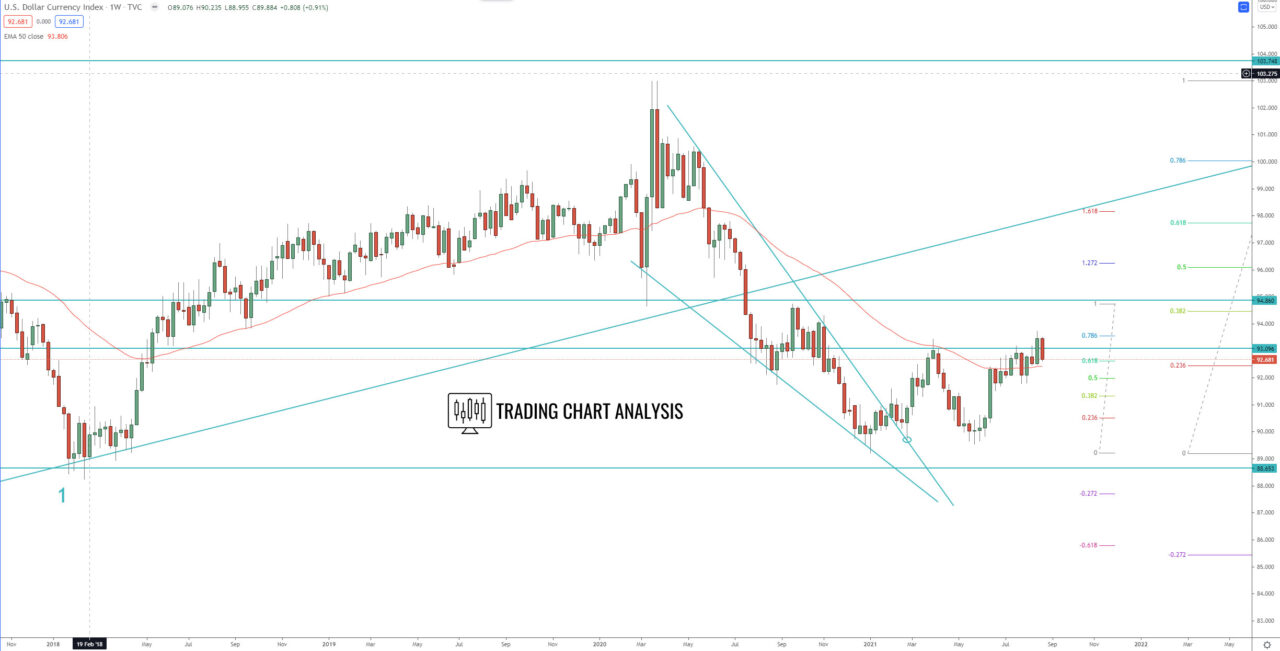
The previous break above the resistance zone between 93.30-93.45 opened the door for a bullish run toward the 0.386 FIB retracement on the monthly chart at 94.50. However, on the four-hour chart, the DXY dollar index broke down, which is a signal for potential further declines. The first target of the break down on the four-hour chart is the support zone between 92.40 – 92.50 where we have the 0.618 FIB retracement and both the daily and the weekly 50 EMAs. The second target is the 1.272 FIB extension at 92.00, the third target is the 1.618 FIB extension at 91.70.
On the other hand, if the DXY dollar index breaks above 93.20, it will send the price higher toward the previous high at 93.72. A successful close above 93.72 will resume the bullish run toward 94.50.
4H chart:

Daily chart:

Weekly chart:


