|
Getting your Trinity Audio player ready...
|
Technical analysis for the DXY dollar index is showing that the index closed with a bullish inside bar on the weekly chart bouncing from 0.618 FIB and formed morning start on the daily chart. This bullish bounce materializes аs a break above а bullish flag on the 1H chart, the first target of this break is at 0386 FIB retracement at 91,60, the second is at 0,618 FIB retracement at 92,30.
On the other hand, if the DXY dollar index break below last week’s low at 90.42, it will be a signal for a further decline toward first the previous low at 89.70 and second toward the previous weekly low at 89.20.
1H chart:

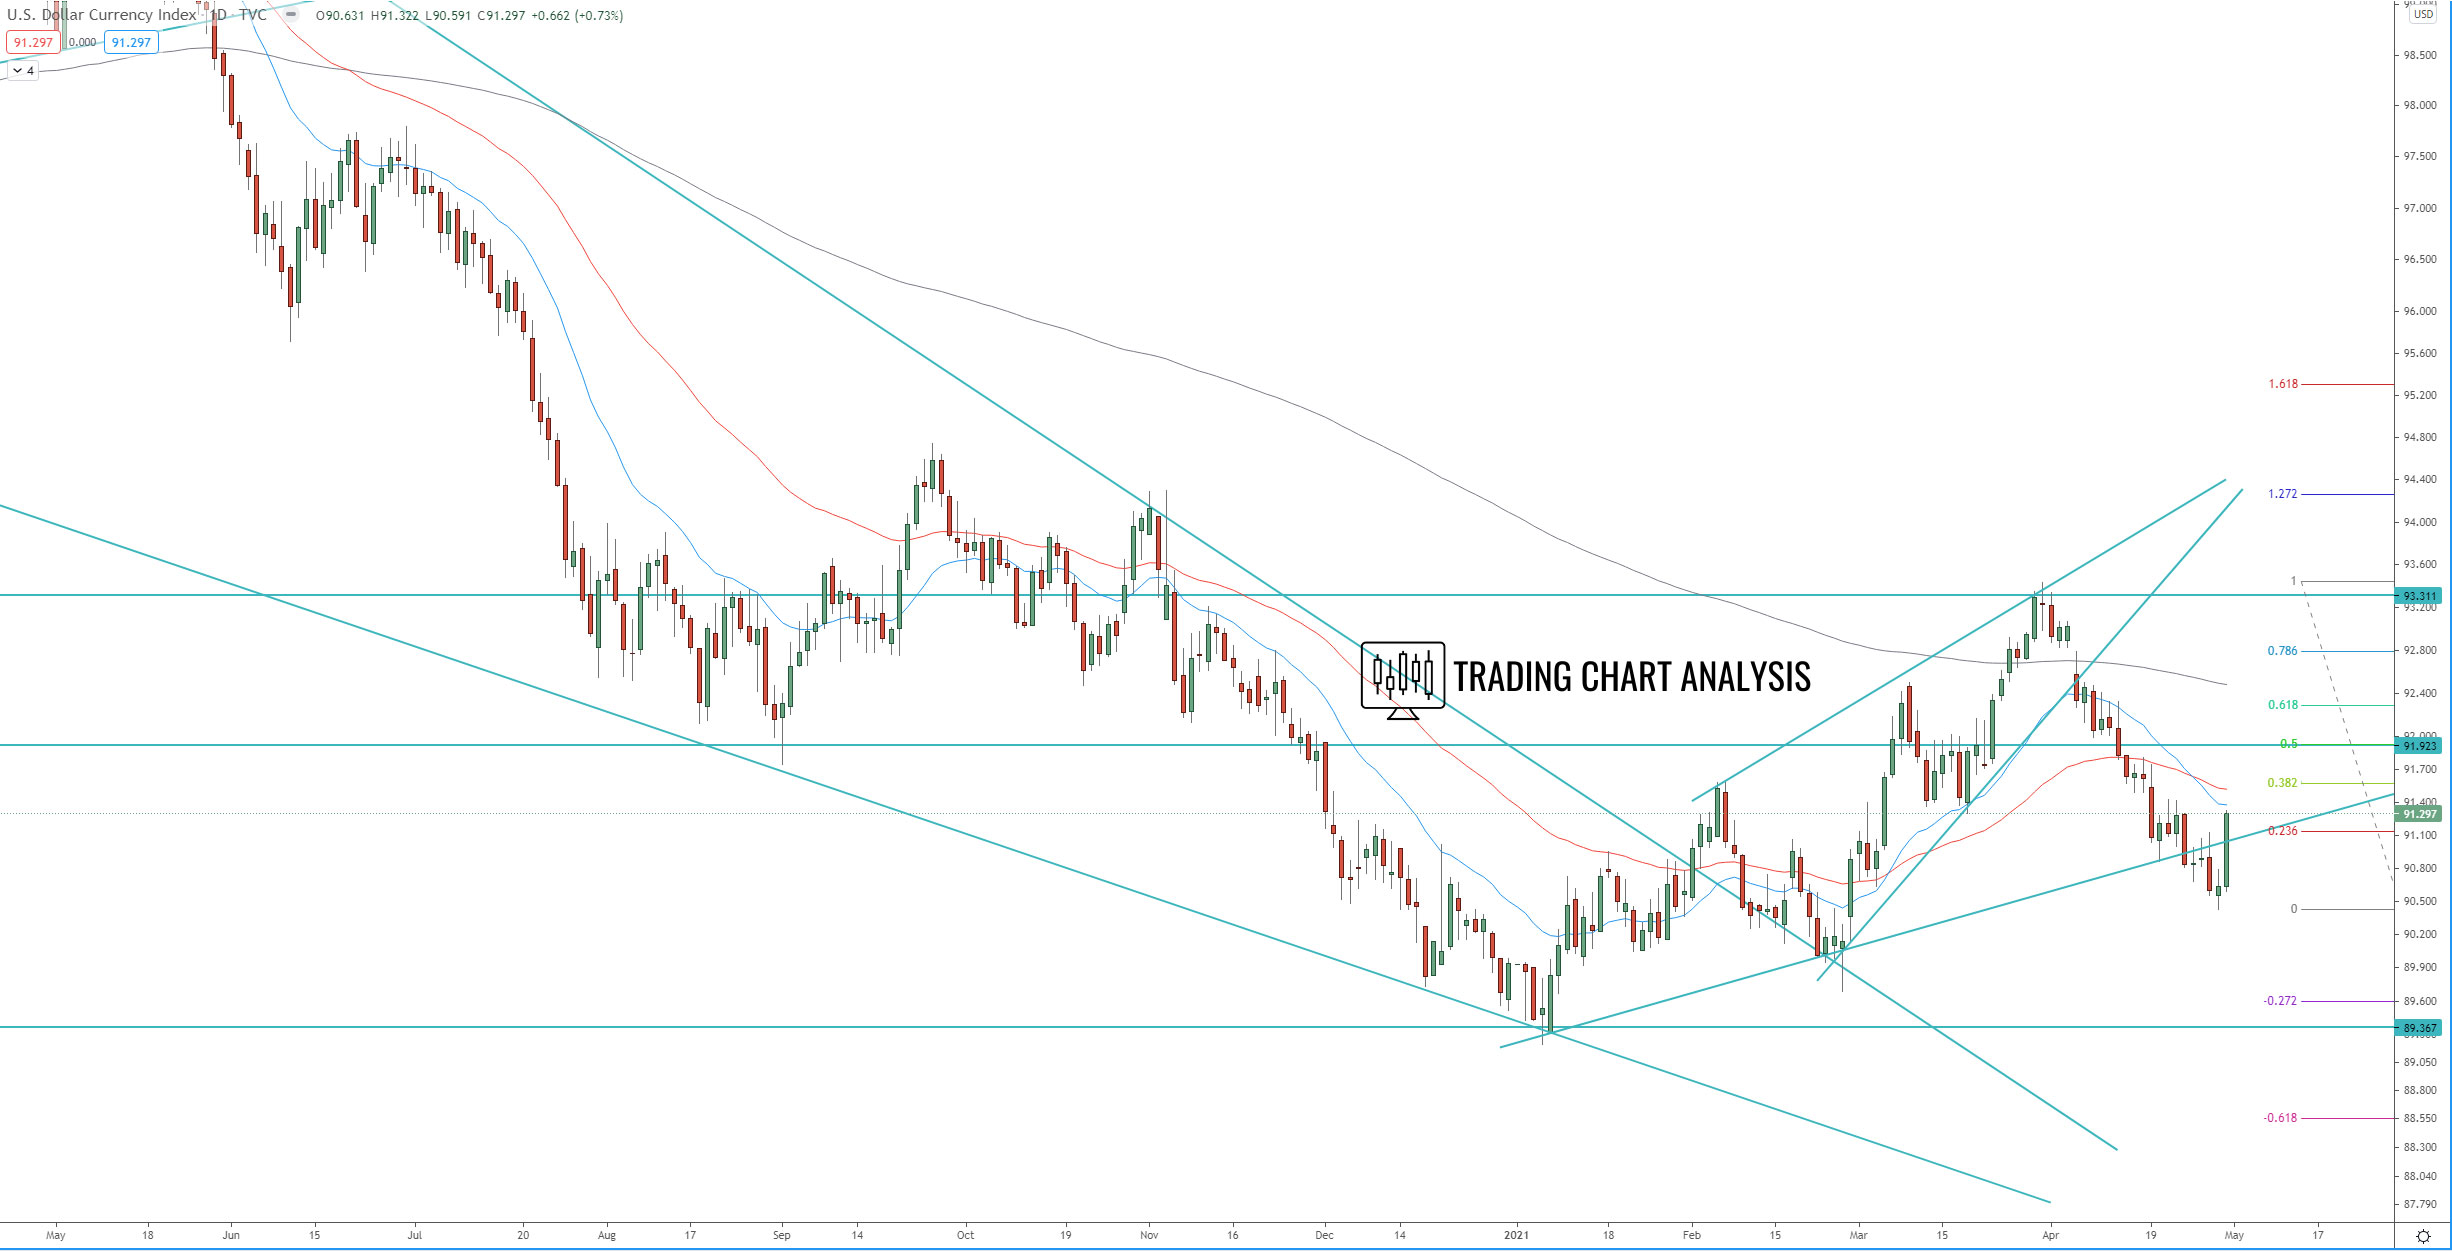
Daily chart:
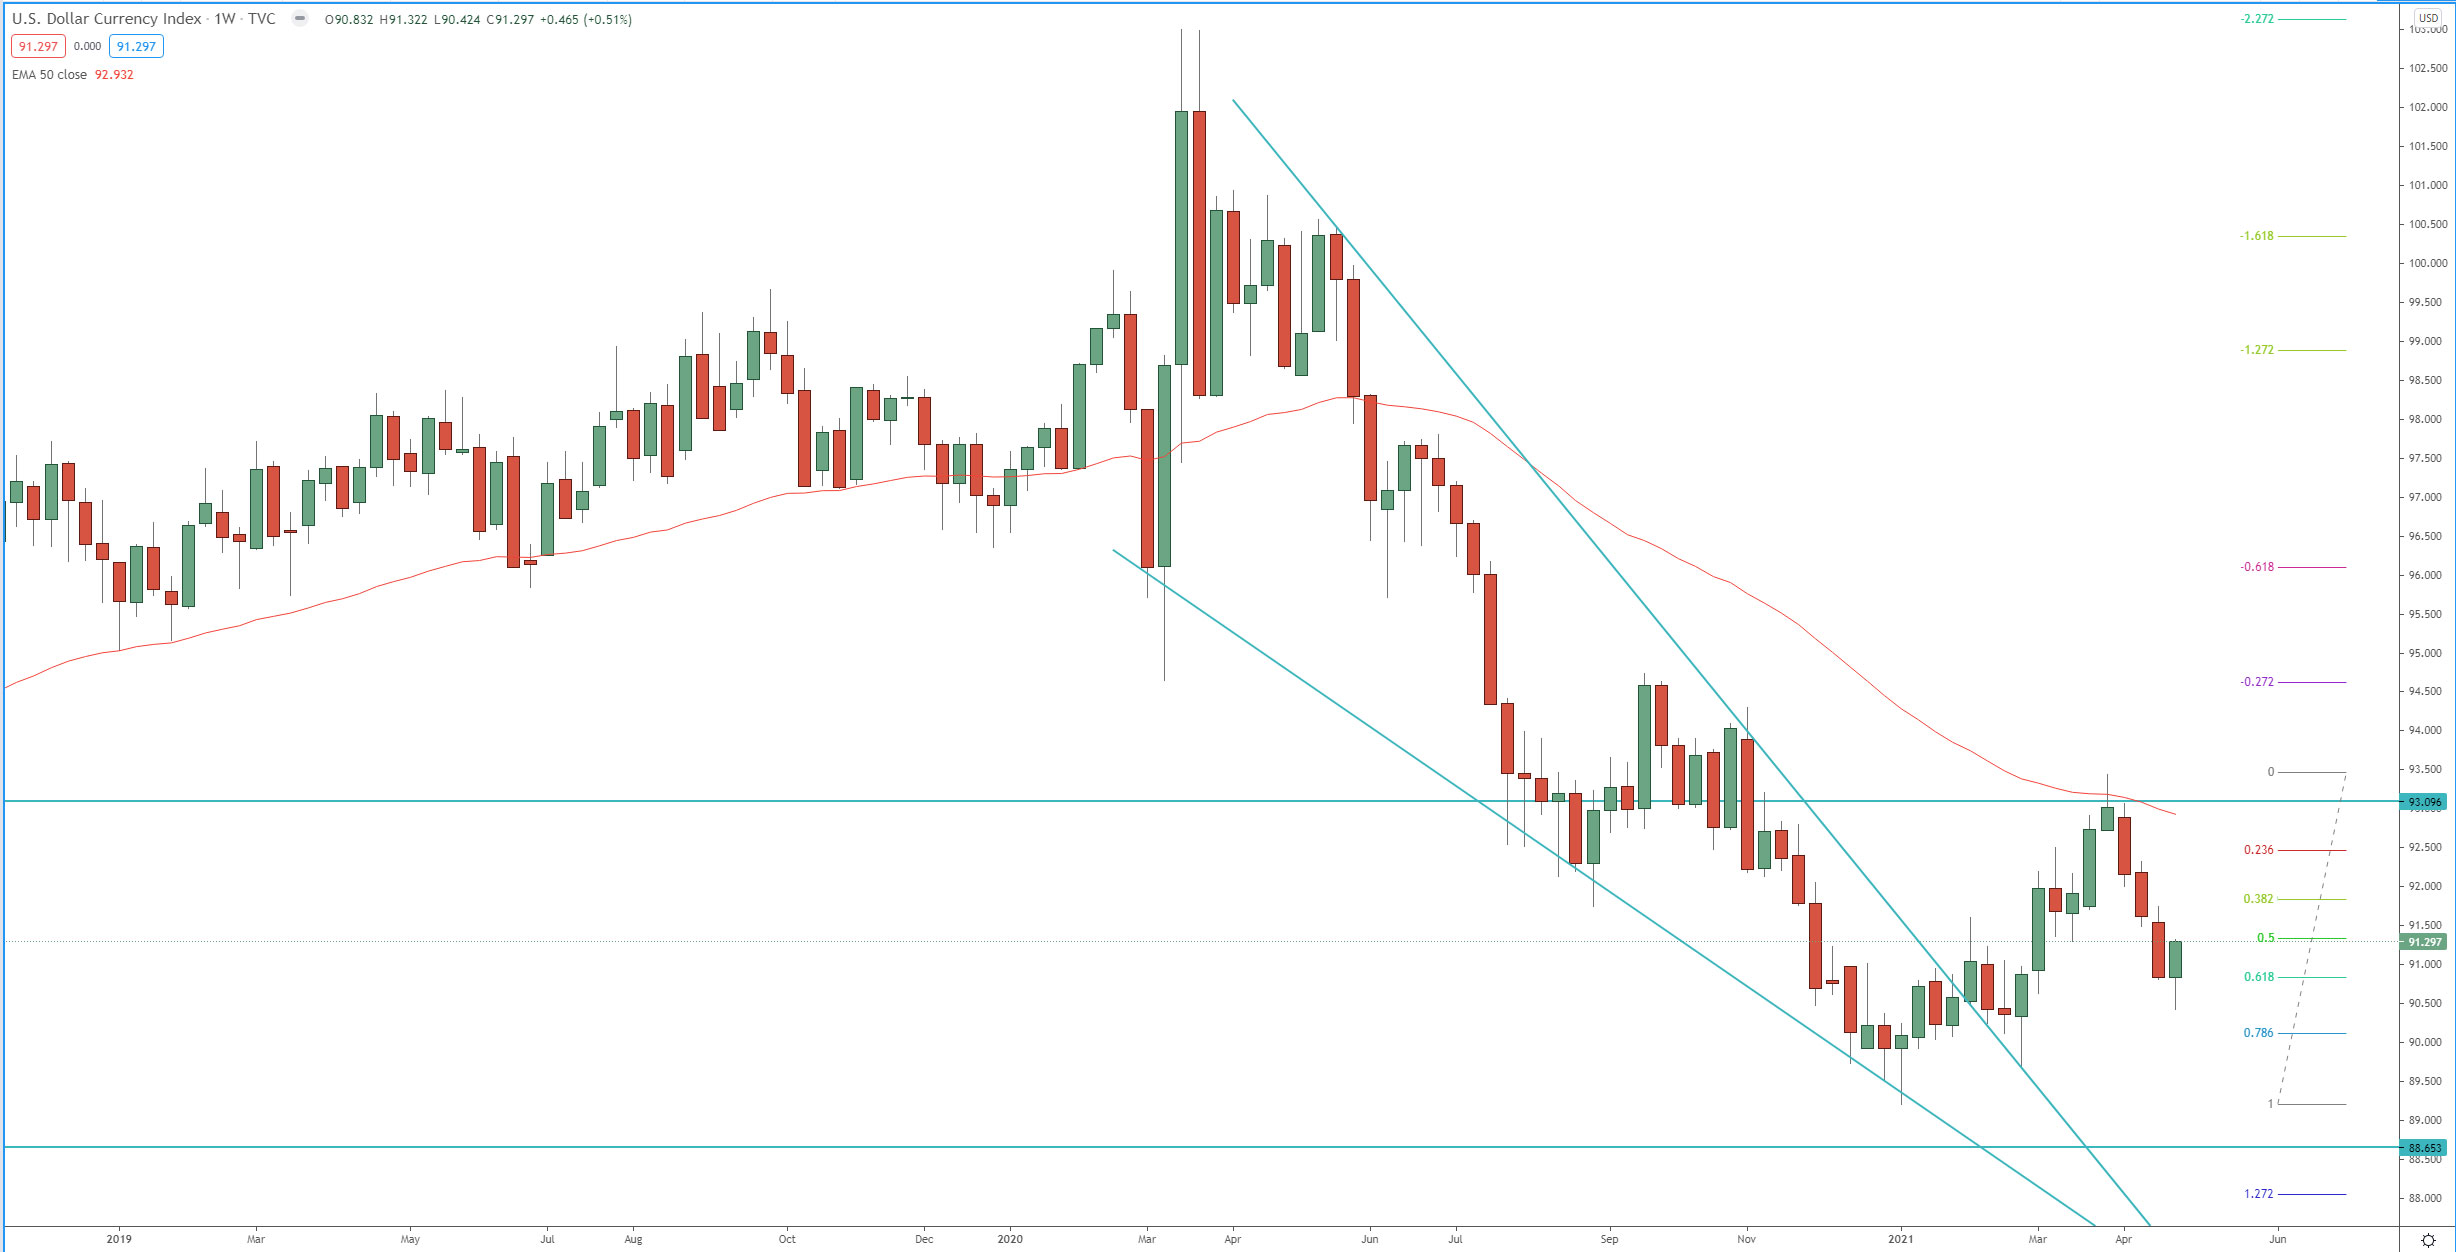
Weekly chart:
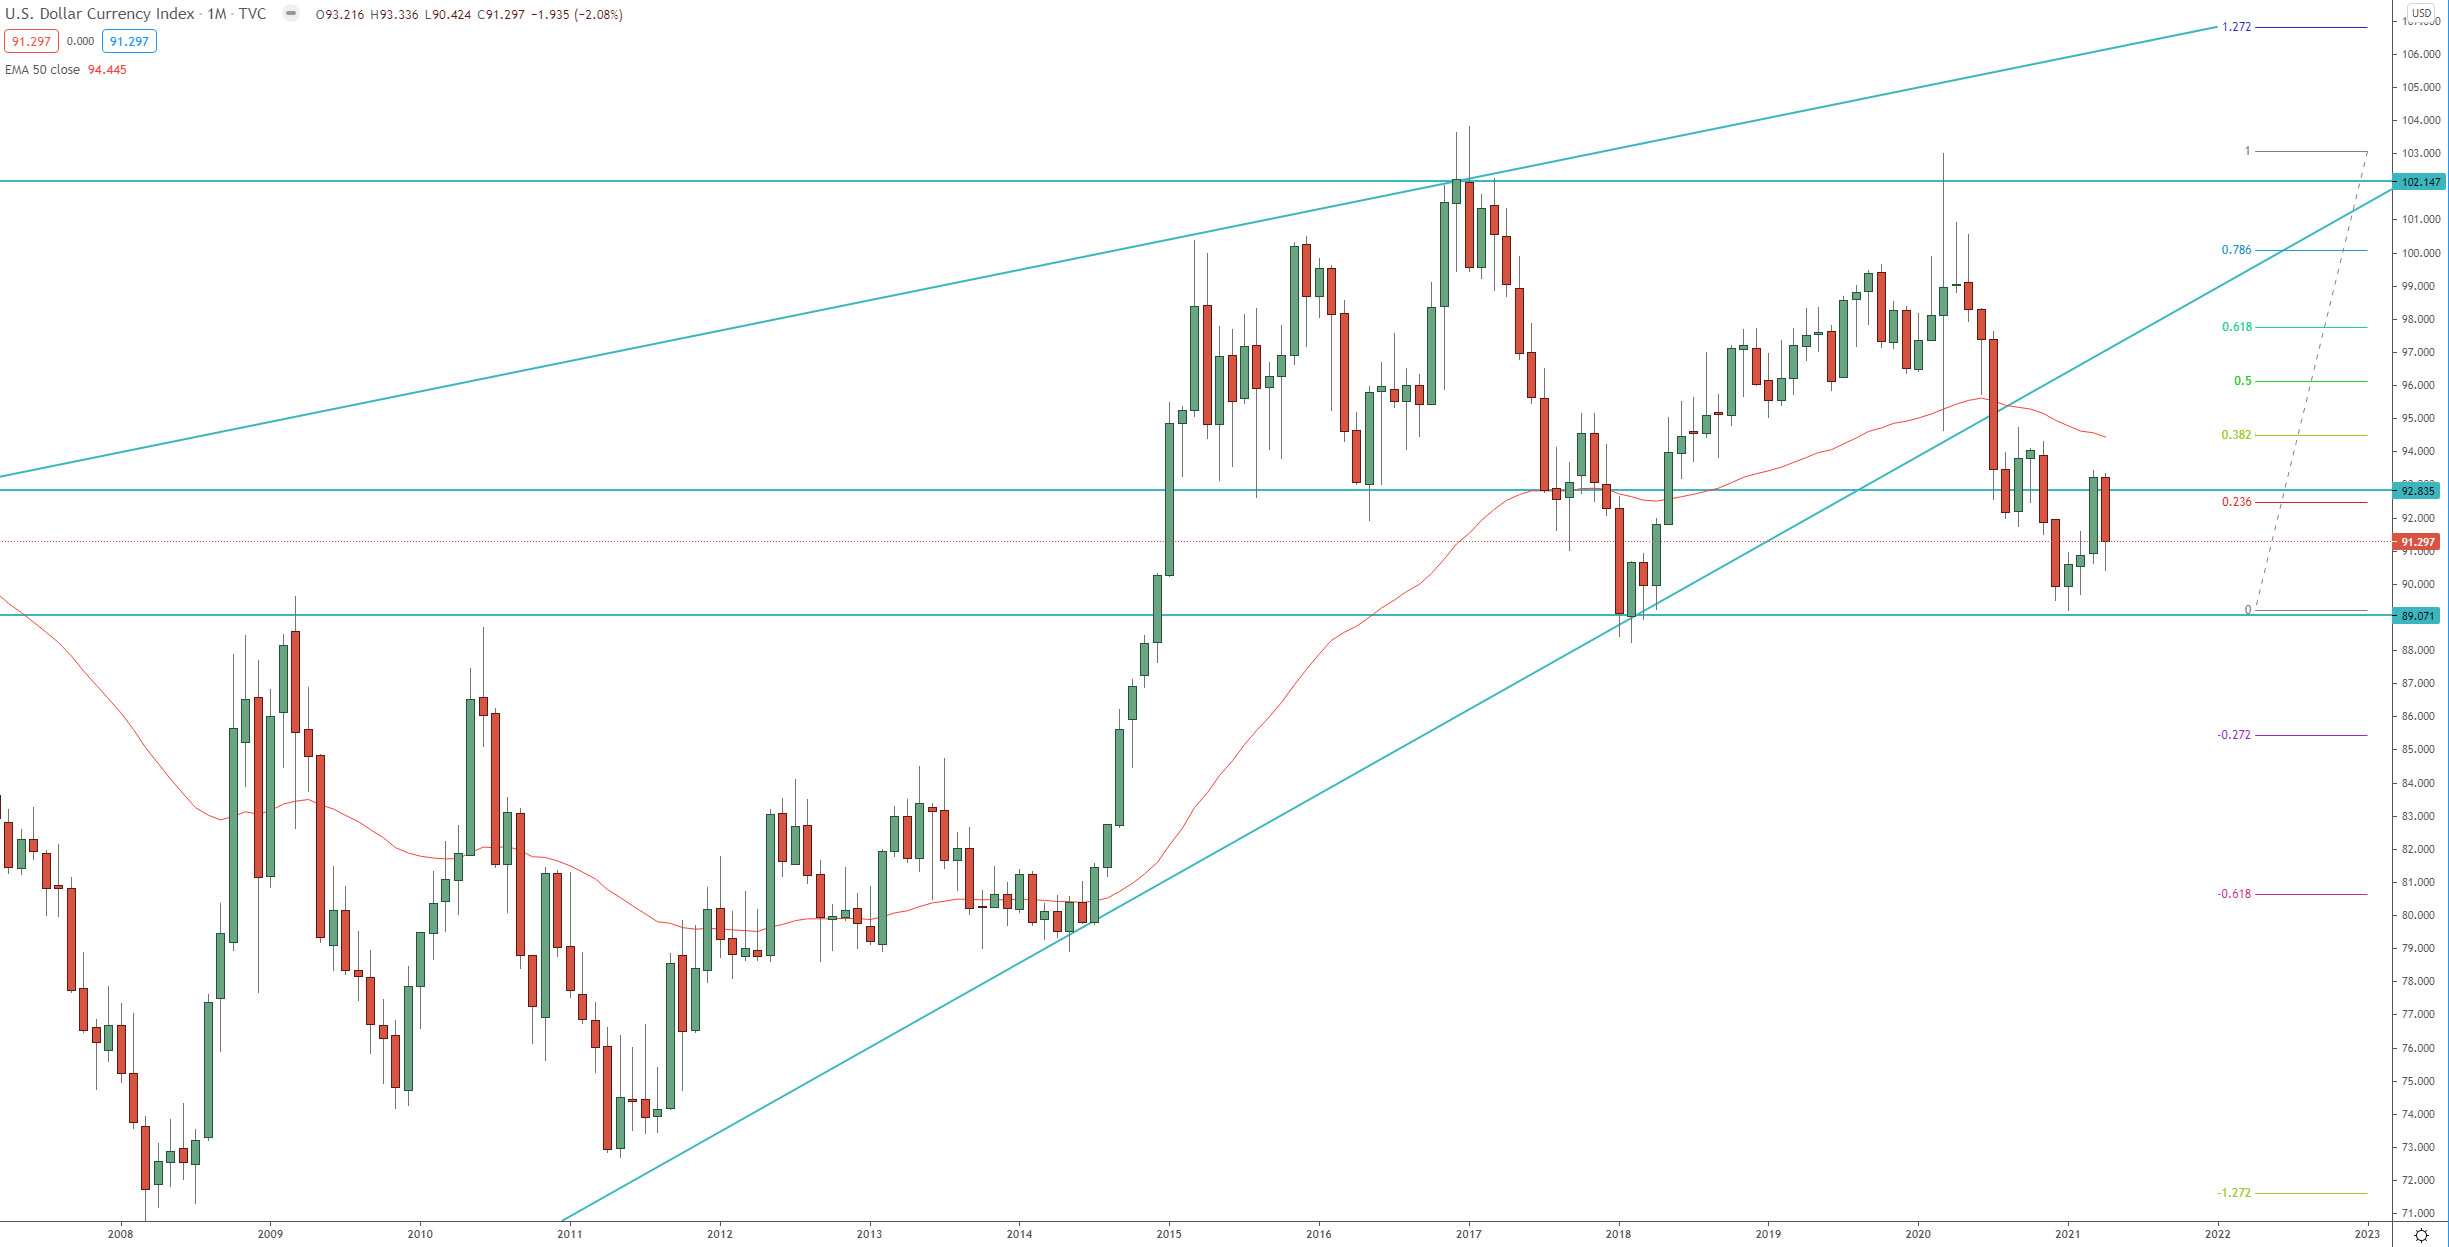
Monthly chart: