|
Getting your Trinity Audio player ready...
|
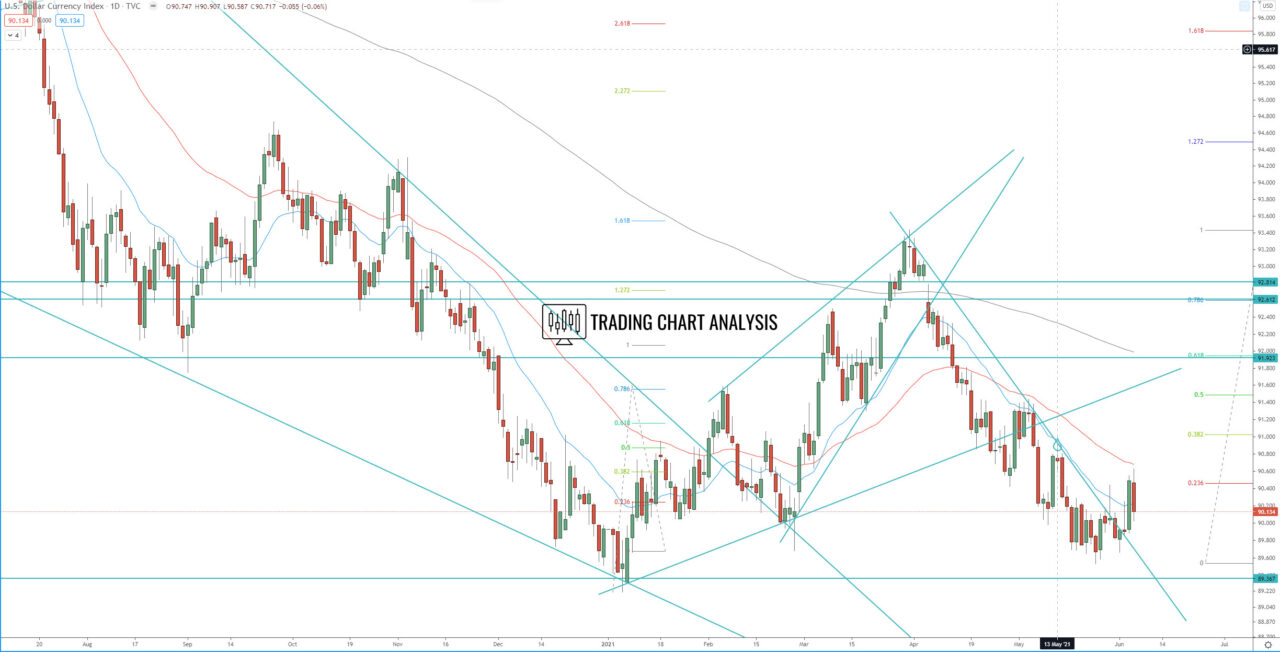
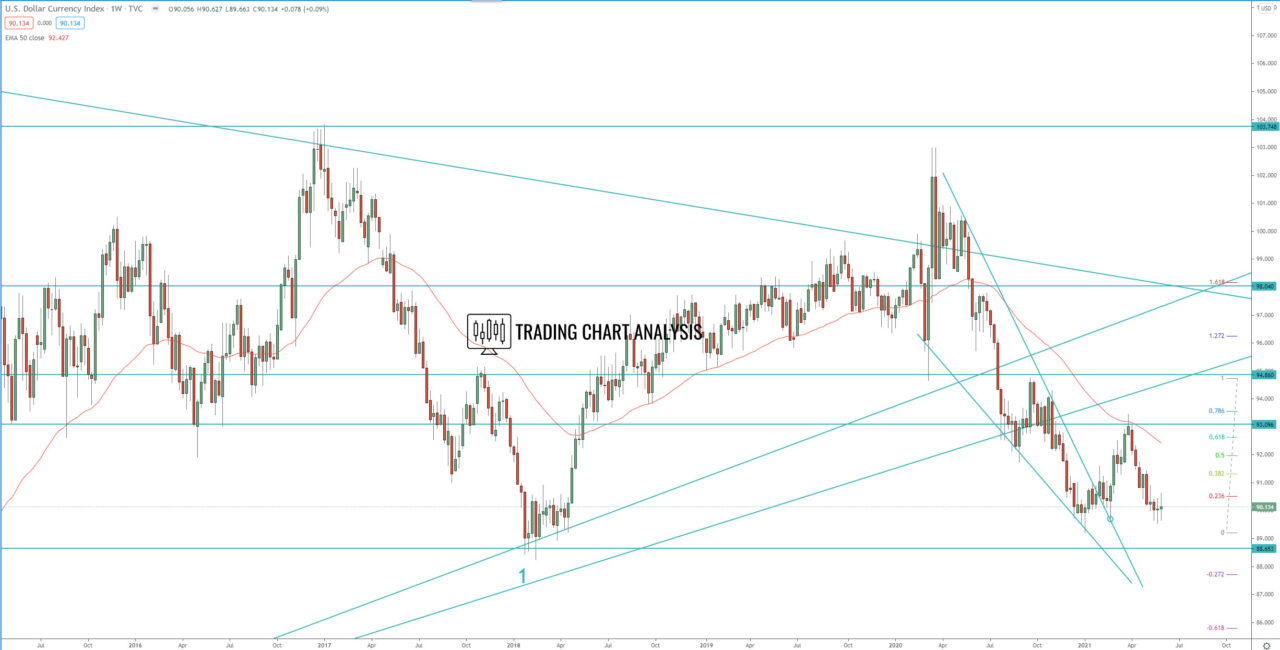
DXY dollar index technical analysis, the index is decelerating at support zone for three weeks now, unwilling to break lower for a retest of 2021 low and eventually a retest of 2018 low. If the index break below the current range, and the 2021 low at 89.20, it will send the price lower for a retest of the 2018 low at 88.25. And if the index eventually breaks below the 2018 low at 88.25, it will accelerate the bearish pressure and open the door for a run toward, first 1.618 FIB extension of the weekly bearish wave at 86.00, and second toward the 1.272 FIB extension of the monthly bearish wave at 80.40.
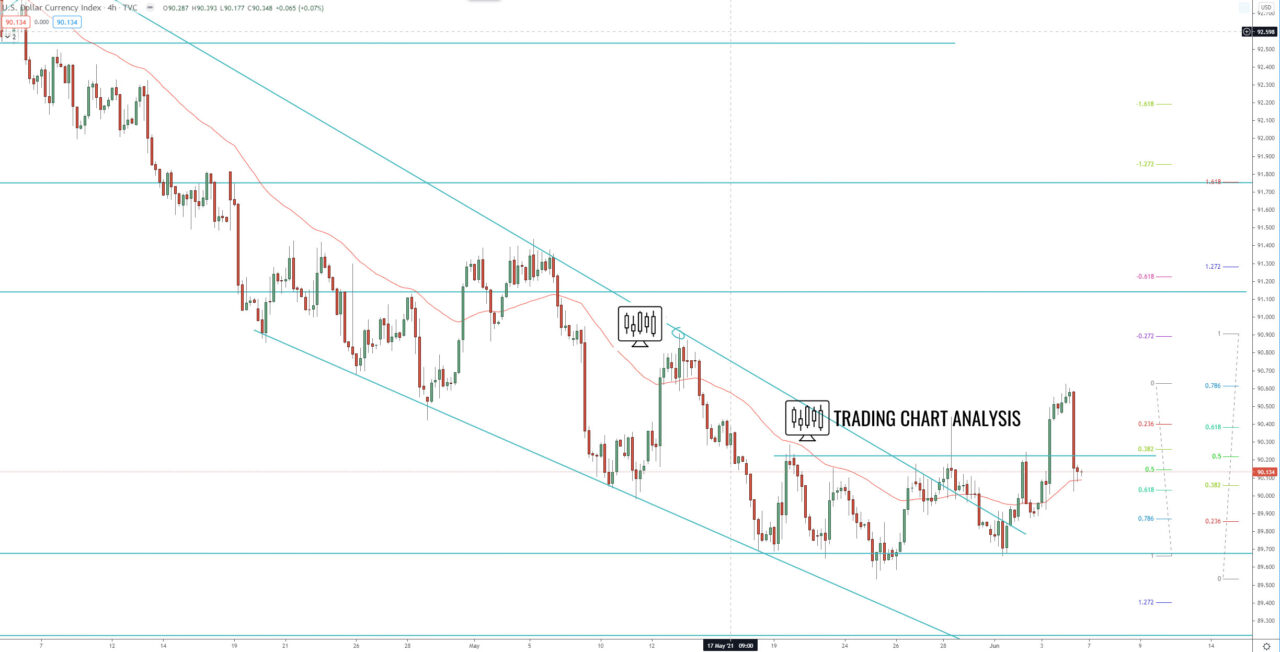
The focus for the week ahead is on the previous week’s high at 90.62. Looking at the 4H chart we can see that the DXY index broke out of descending price channel and started a consolidation. Last week the index break out of this consolidation on the 4H chart, but there wasn’t follow-through and the price quickly retraced back in the range. If the DXY index break above last week’s high at 90.62 it should send the price higher toward first, 1.272 FIB extension at 91.40, and second toward 1.618 FIB extension at 91.80.
4H chart:

Daily chart:

Weekly chart:


