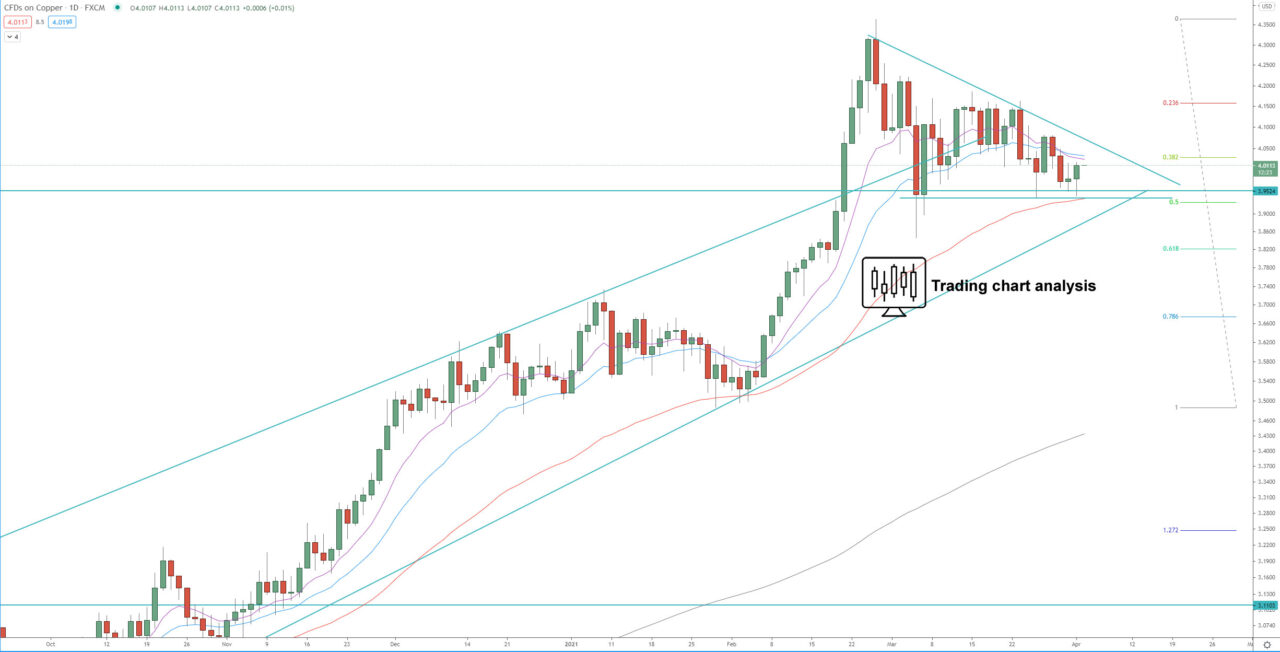
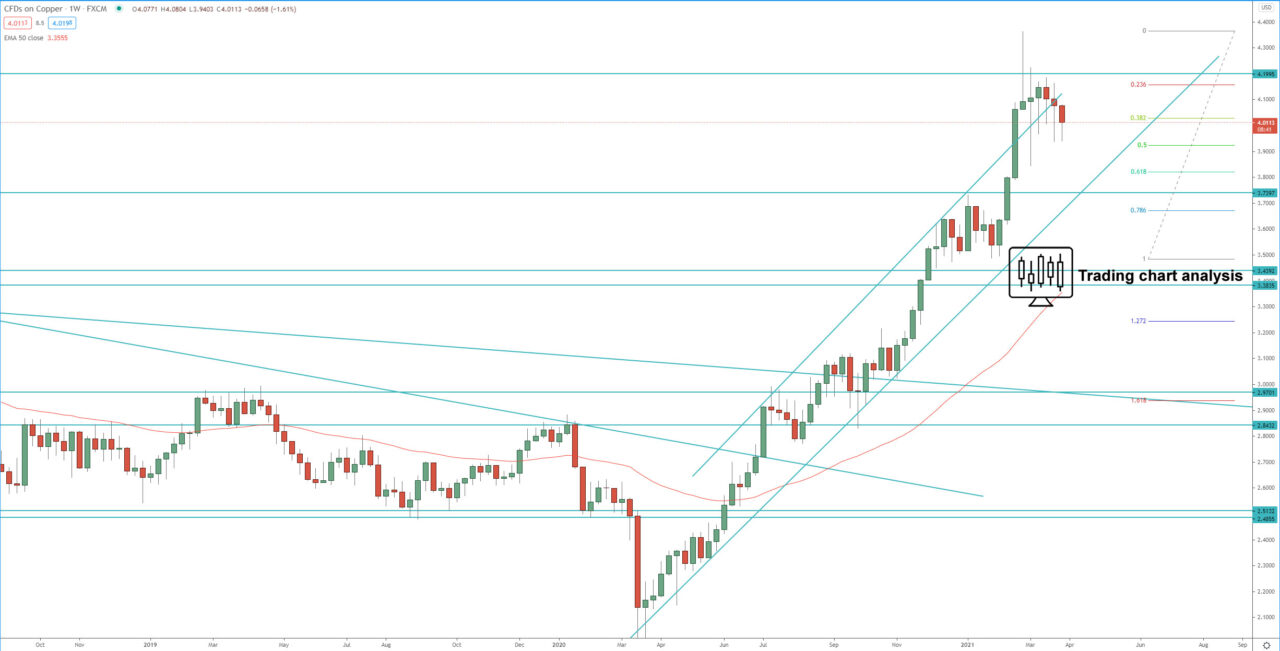
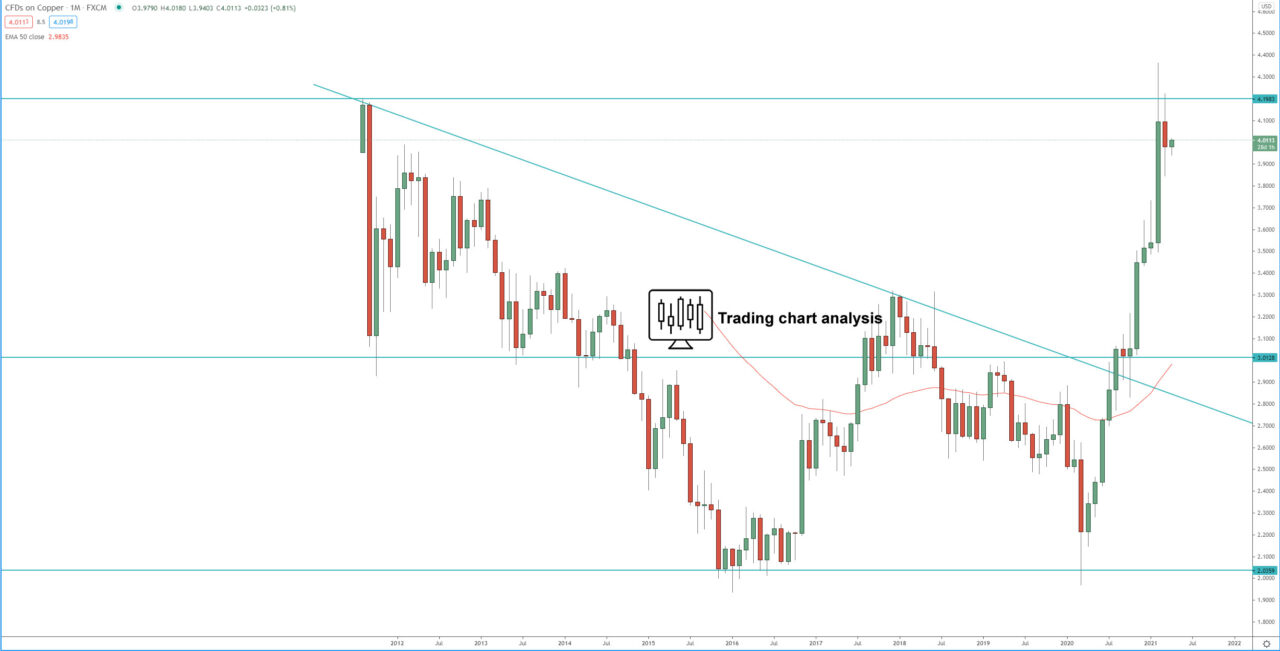
Technical analysis for Copper is showing, that after five weeks of consolidation the price formed descending triangle on the daily chart and the 4H chart. If the price breaks above the descending triangle, it will send Copper higher toward the previous weekly high at 4.36.
If the price breaks below the descending triangle on the daily chart, it will send the price of Copper lower toward, first 1.272 FIB extension at 3.81, and second toward 1.618 FIB extension at 3.700.
Daily chart:

Weekly chart:

Monthly chart:


