|
Getting your Trinity Audio player ready...
|
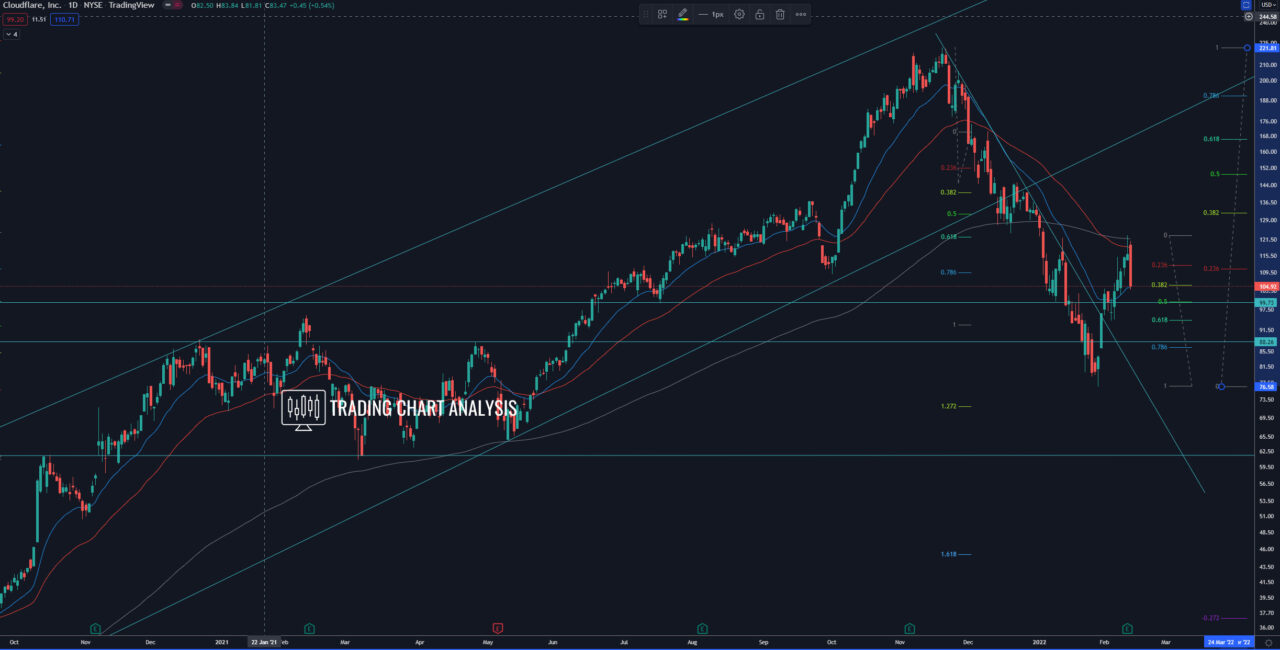
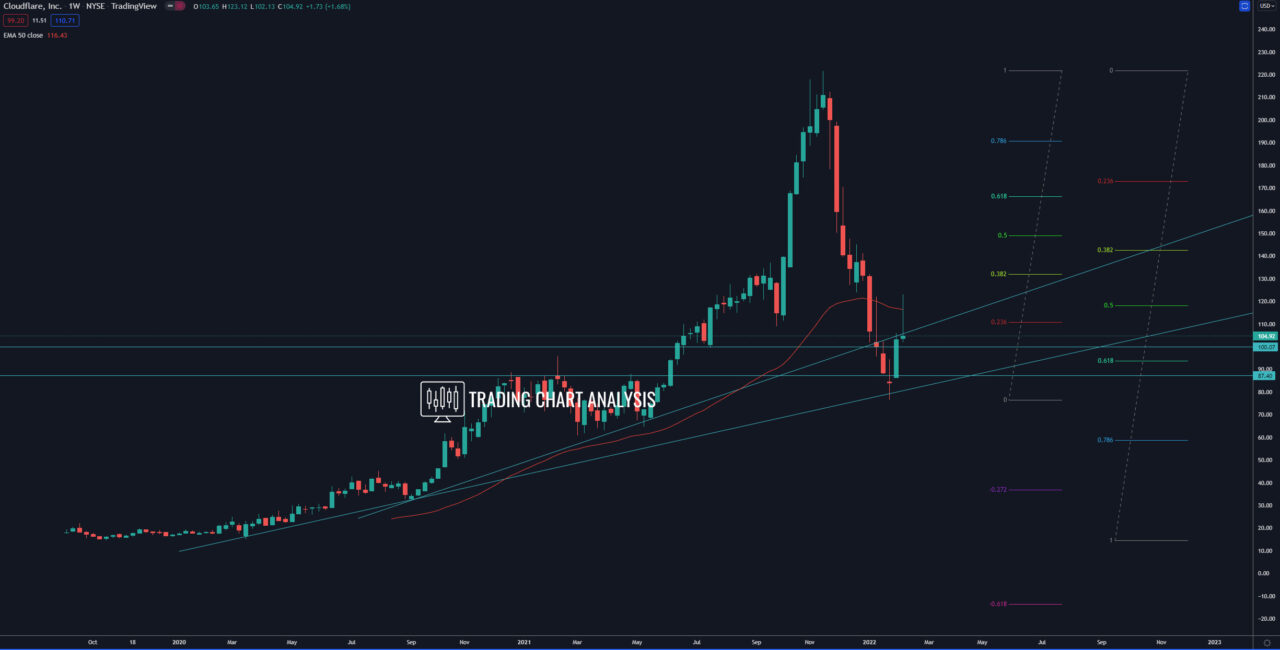
Technical analysis for Cloudflare Inc. (NET), the shares completed the fifth bullish wave on the daily chart, reached the 2.727 FIB extension at 205$. The shares of Cloudflare went as high as 221.64$ and started a pullback, which eventually broke below ascending price channel on the daily chart and turned into a bearish trend. The first target for this bearish trend was 0.382 FIB retracement on the weekly chart around 142$-143$. The second target was the 0.618 FIB retracement on the weekly chart, around 93$-95$. The shares of Cloudflare(NET) went as low as 76.61$ and bounced from a support zone and ascending trendline, starting a pullback. The first target for this pullback is the 0.382 FIB retracement on the daily chart at 132$. The second target is the 0.618 FIB retracement at 166$.
On the other hand, if the shares of Cloudflare(NET) breaks below the previous weekly low at 76.61$, it will resume the bearish trend and send the price of the shares lower. The first target for this bearish trend is the 1.272 FIB extension on the daily chart at 72$. The second target is the 1.618 FIB extension at 45$.
Daily chart:

Weekly chart:


