|
Getting your Trinity Audio player ready...
|
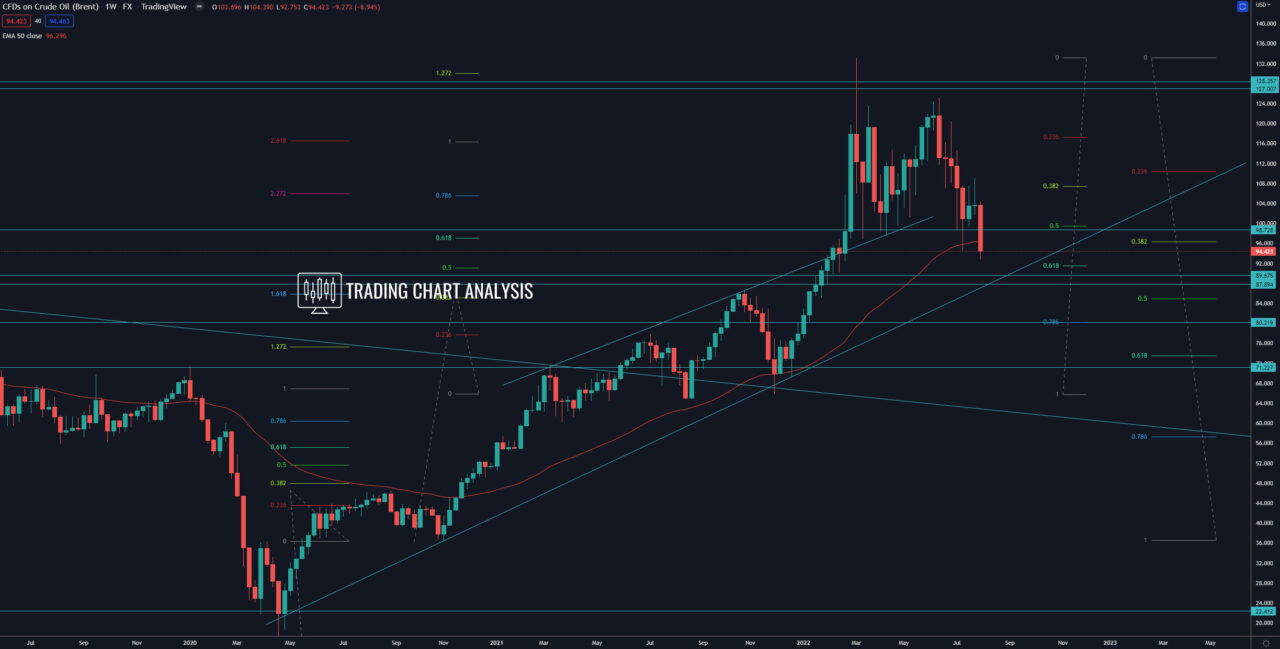
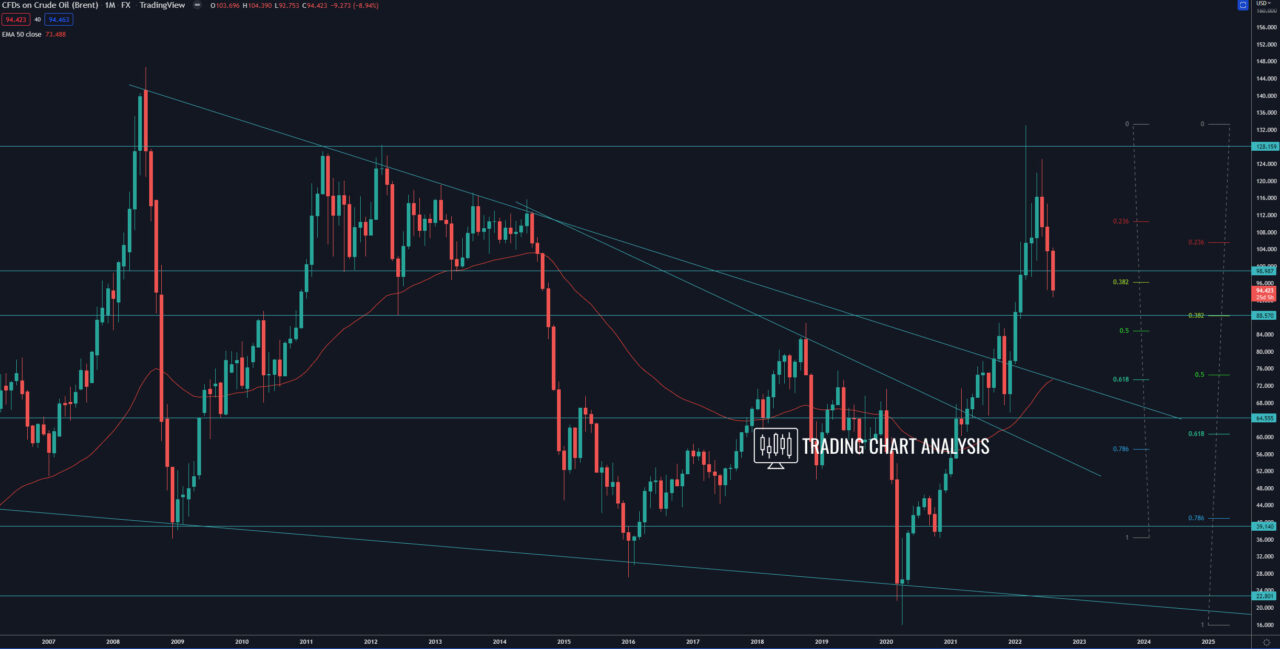
Technical analysis for Brent Crude oil, the price is approaching the 0.618 FIB retracement on the weekly chart at 91.50$, which is the first target for the pullback. The second target for the pullback is the 0.382 FIB retracement on the monthly chart at 88.40$, which is within both dynamic and horizontal support. If the price of Brent Crude oil breaks below the 0.382 FIB retracement and the ascending trend line, that will open the door for a bearish run toward the 0.786 FIB retracement on the weekly chart at 80.25$. The fourth target for such a bearish development is the 0.618 FIB retracement on the monthly chart at 73.50$, which is a 2.618 FIB extension on the daily chart.
If the price of Brent Crude oil bounces from the 0.618 FIB retracement on the weekly chart at 91.50$, that could start a pullback on the daily chart. The first target, in that case, is the 0.382 FIB retracement on the daily chart at 99.00$, where we have a resistance. The second target is the 0.618 FIB retracement on the daily chart at 102.80$. The fourth target is the resistance on the daily chart at 107.60-109$.
Weekly chart:

Monthly chart:


