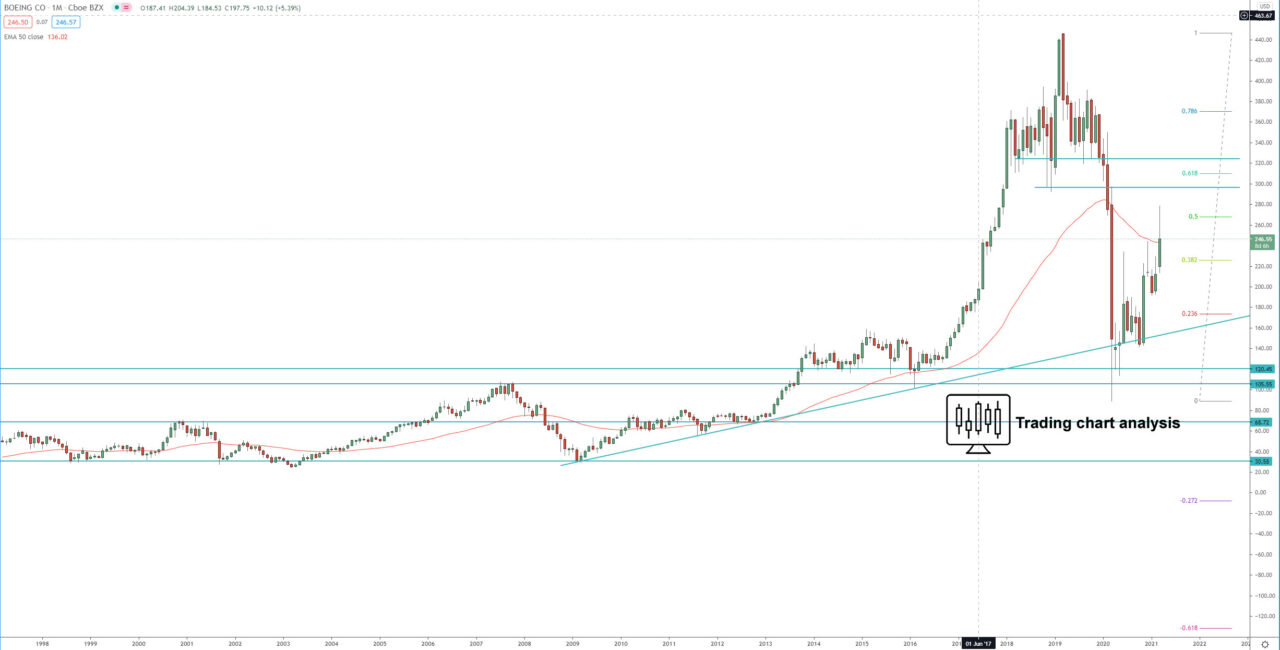
Technical analysis for the Boeing CO. shares is showing that after the initial plunge during the COV19 pandemic and the many difficulties that Boeing experienced with their MAX 737 and the global grounding of the aircraft, the stock finally found support at the 2016 low and support zone around 100.00$.
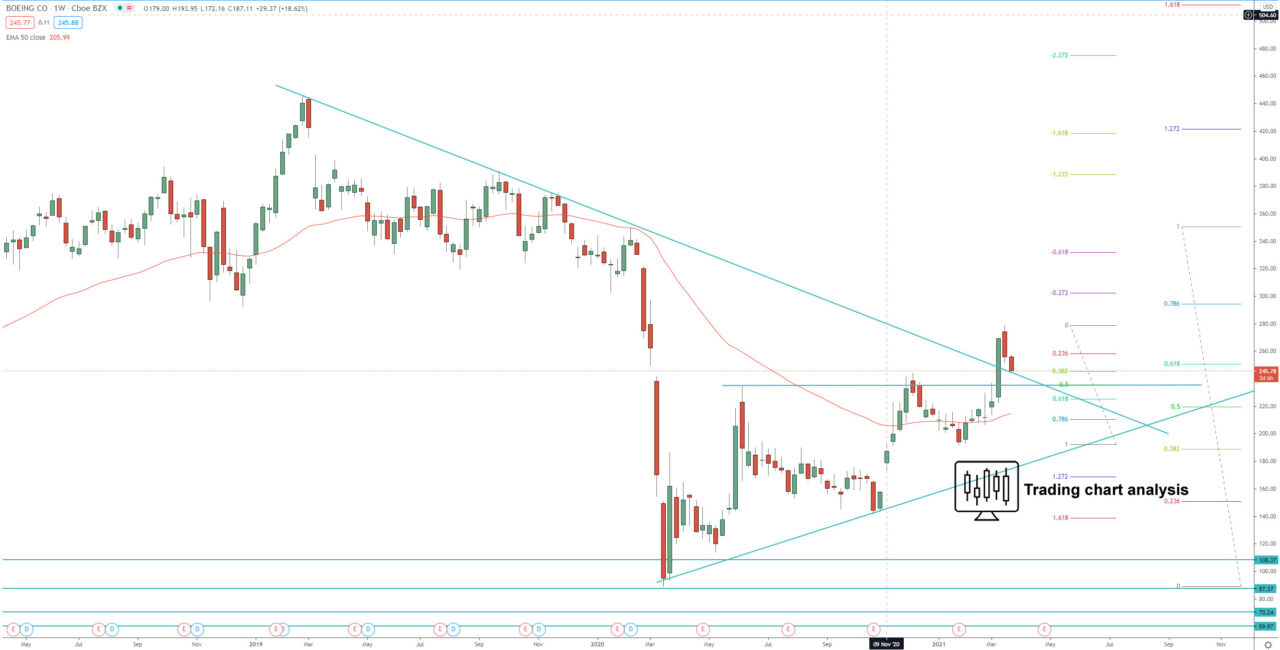
Boeing shares started a recovery during the spring and the summer of 2020, and now at the begging of March 2021, we are witnessing a break above the previous weekly high and resistance above 234$. The price of Boeing stock also broke above descending trend line on the weekly chart. The first target of this breakout is at 1.272 FIB extension at 325$, the second target is at 1.618 FIB extension at 375$.
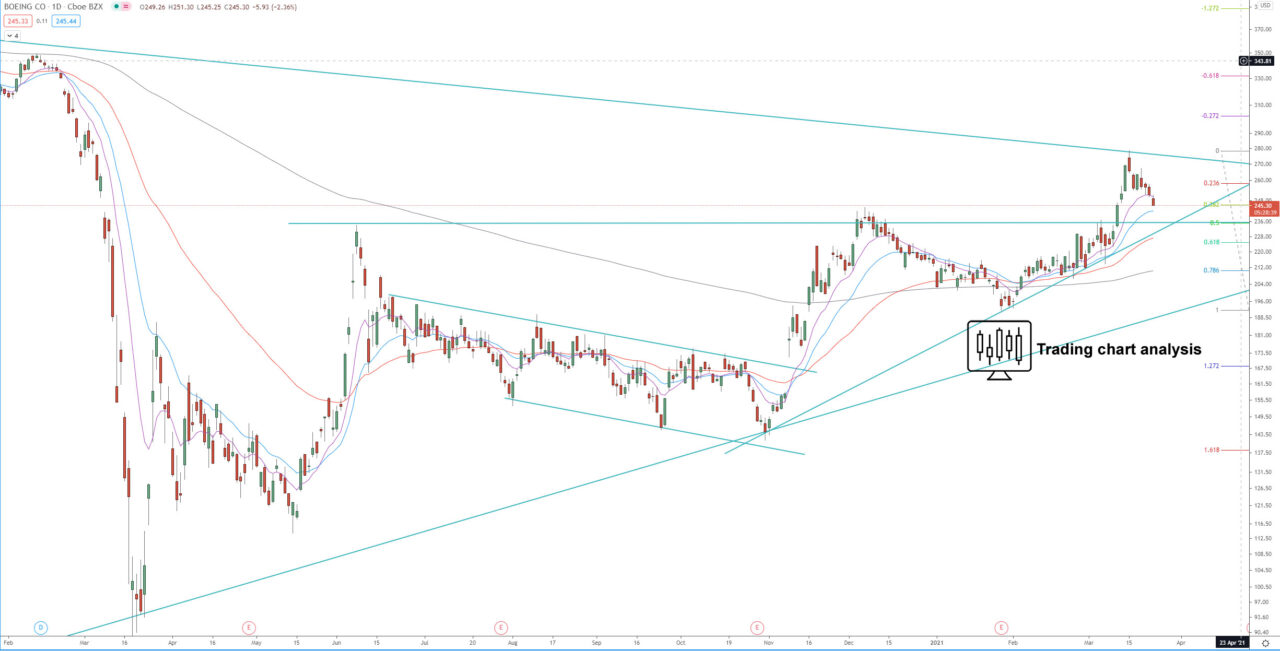
Support levels to watch for rejection and resumption of the weekly bullish run are at 234$, which is previous resistance now support, 192$, which is a previous weekly low, and below that, key support to watch is at 141$.
Monthly chart:

Weekly chart:

Daily chart:


