|
Getting your Trinity Audio player ready...
|
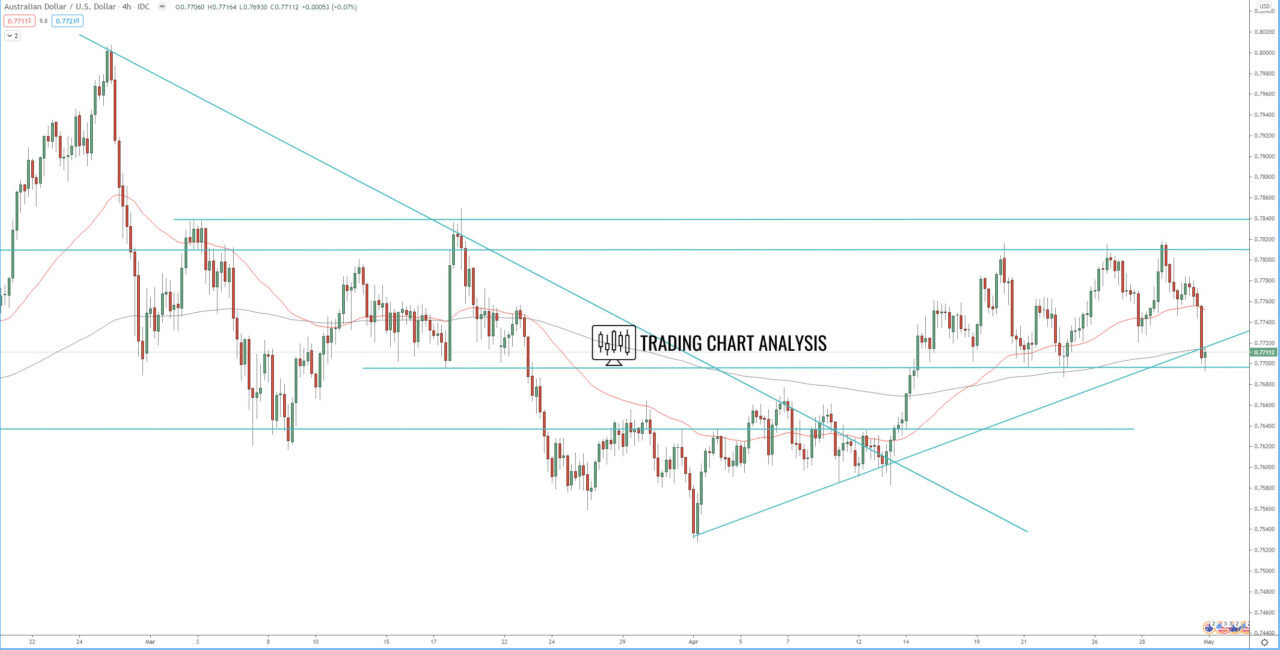
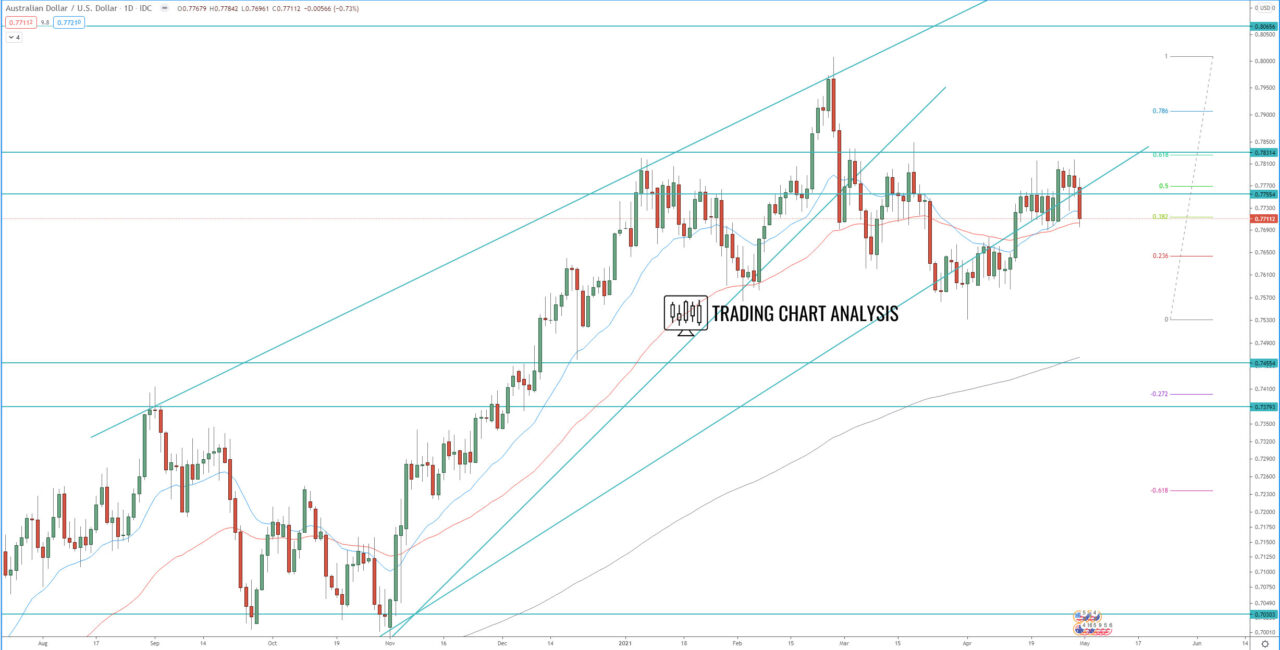
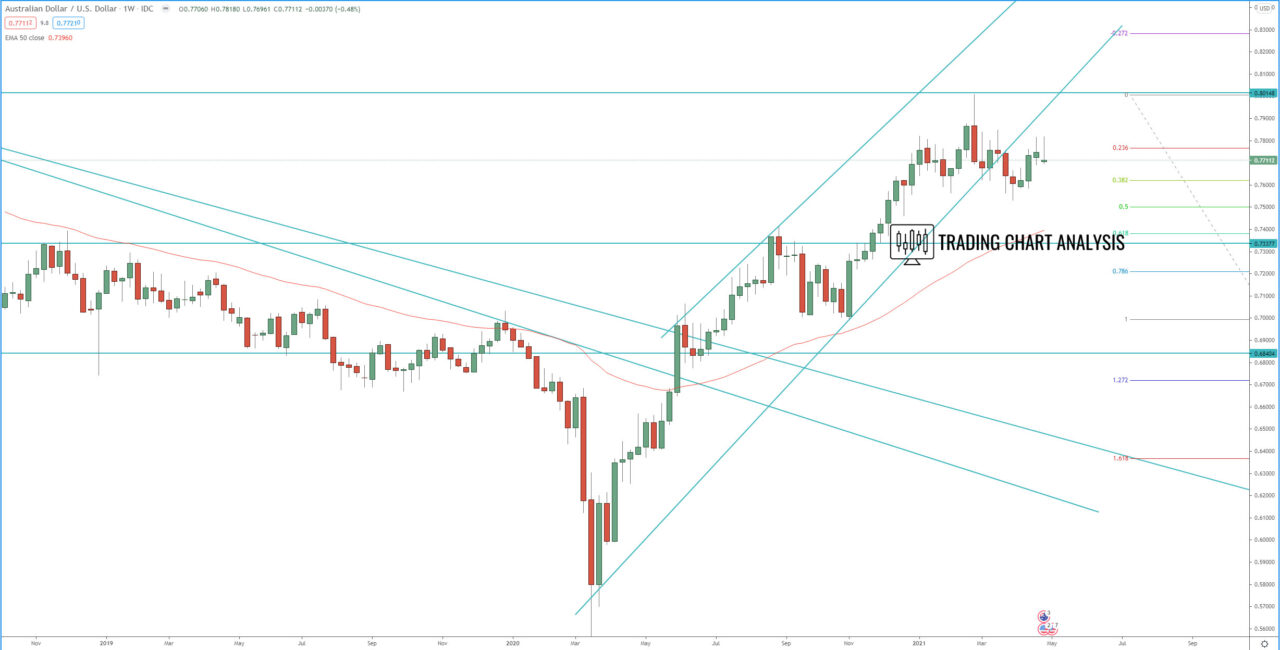
Technical analysis for the AUD/USD is showing that the price formed tweezer tops on the weekly chart rejecting the previous weekly high. However, the price is in a range on the 4H chart. If we see a breakout to the downside of the range on the 4H chart, break below 0.7685, it will be a signal for further downside potential with the first target 0.7585, second target the previous weekly low at 0.7531.
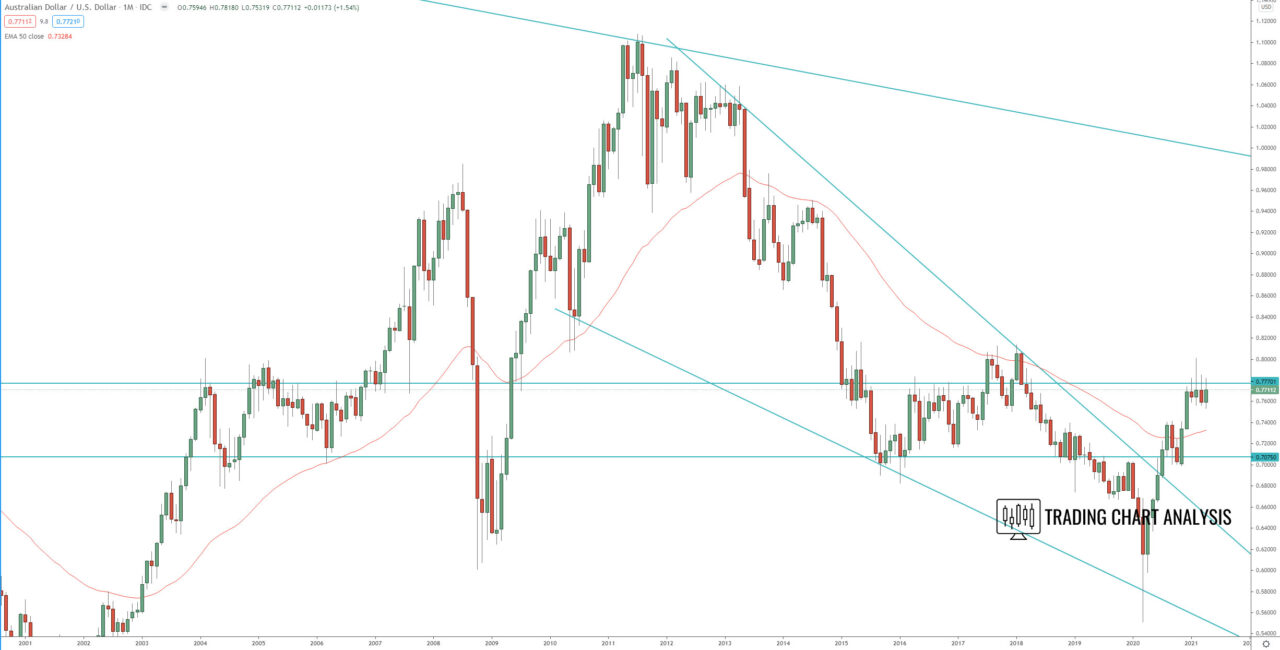
On the other hand, if the AUD/USD pair break above the range, above 0.7818, it will be a signal for further upside potential toward, first the previous daily high at 0.8007, and second toward the 2018 high at 08135.
Review our technical analysis for the AUD/USD pair for potential targets for 2021.
4H chart:

Daily chart:

Weekly chart:

Monthly chart:


