|
Getting your Trinity Audio player ready...
|
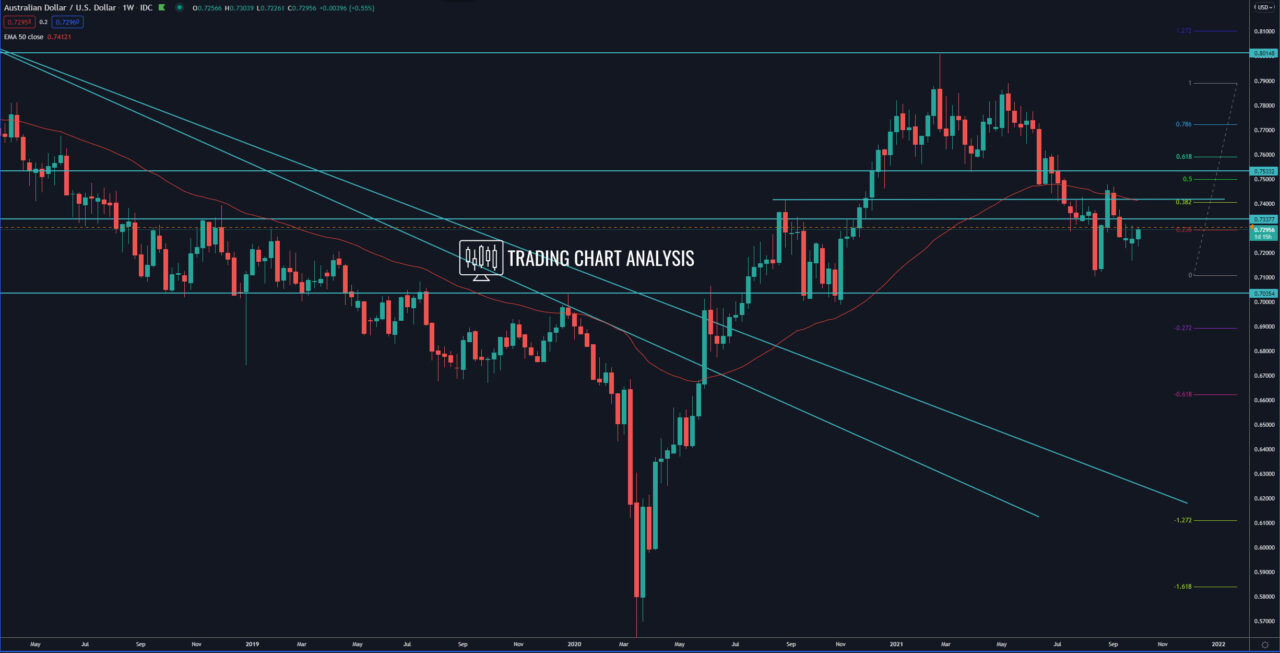
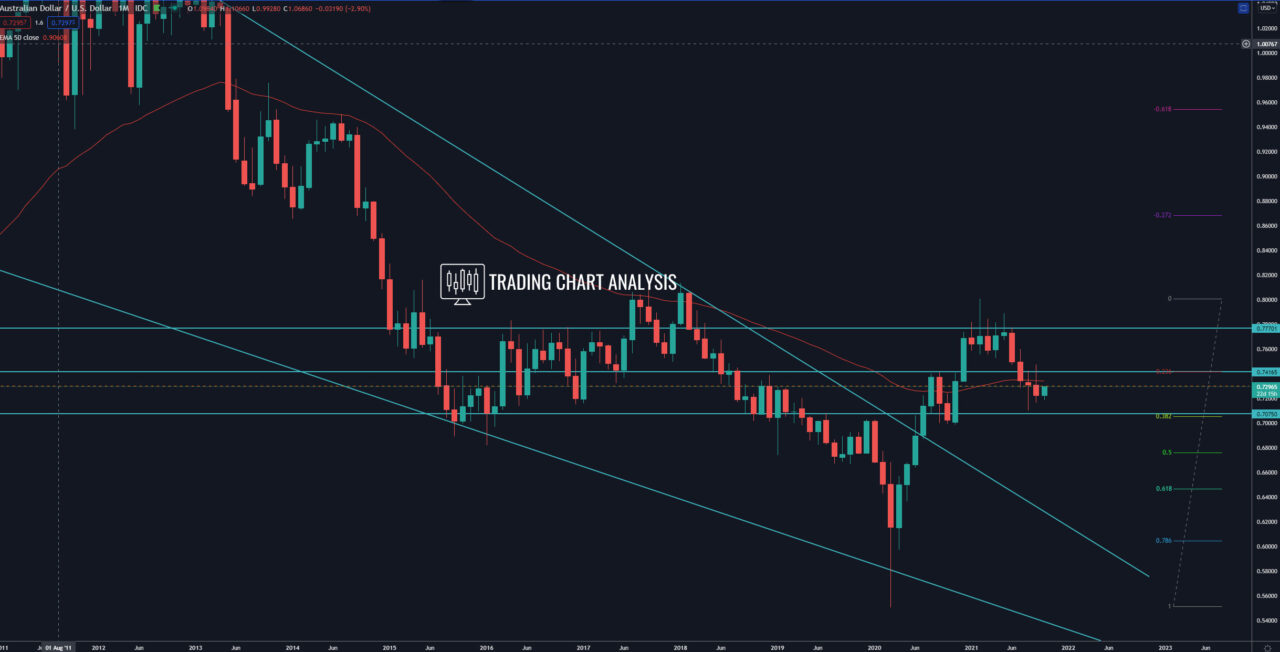
Technical analysis for the AUD/USD, the pair reached the second target of the daily bearish wave at 1.618 FIB extension at 0.7120 and started a pullback. This pullback almost reached the 0.500 FIB retracement on the weekly chart at 0.7500. The price reached 0.7478 and reversed to continue the bearish leg. On the monthly chart, the latest leg down for the AUD/USD pair didn’t reach the 0.386 FIB retracement at 0.7050, which is why further declines are in favor, with target the support zone between 0.7000 – 0.7050.
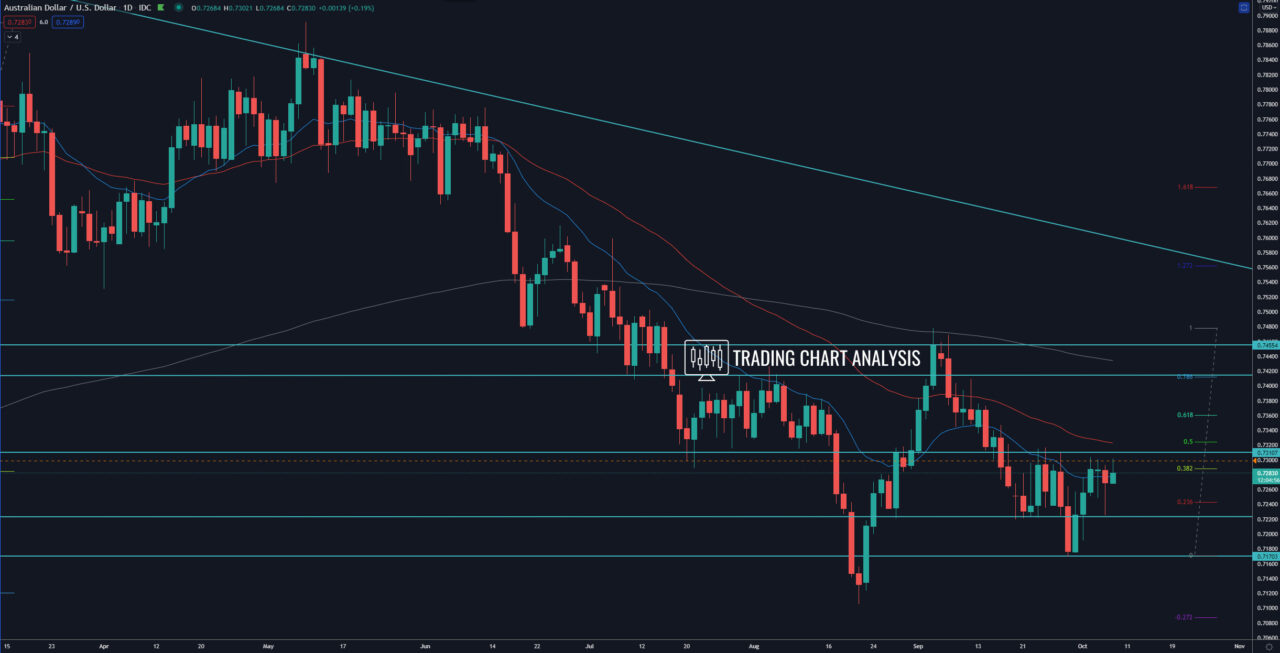
On the daily chart, the AUD/USD pair is trading in a range, below a resistance zone and 0.500 FIB retracement at 0.7325. A break above 0.7325 will send the AUD/USD higher toward the previous high at 0.7478. A break above 0.7478 will open the door for a bullish run toward first the 100 FIB extension at 0.7550, second the 0.618 FIB retracement at 0.7600, and the third the 1.272 FIB extension at 0.7645, and eventually the 1.618 FIB extension at 0.7770.
On the other hand, if the AUD/USD pair break below the low at 0.7170, it will send the price lower toward the previous low at 0.7106 and then toward the support zone between 0.7000 – 0.7050.
Daily chart:

Weekly chart:

Monthly chart:


