|
Getting your Trinity Audio player ready...
|
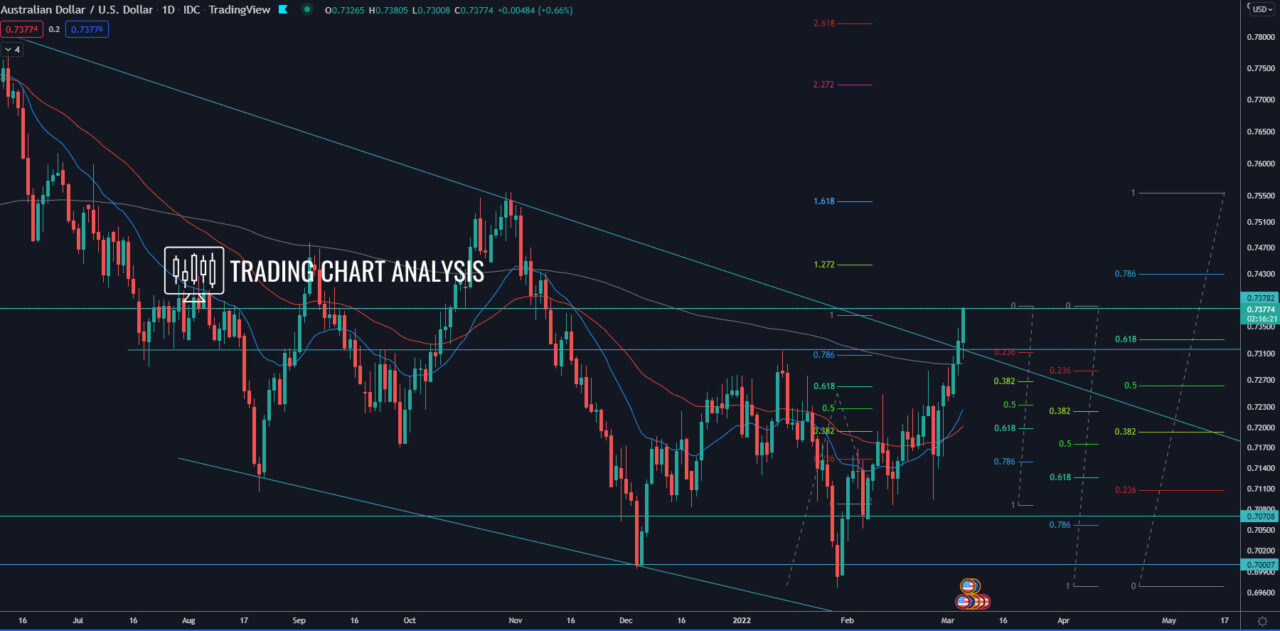
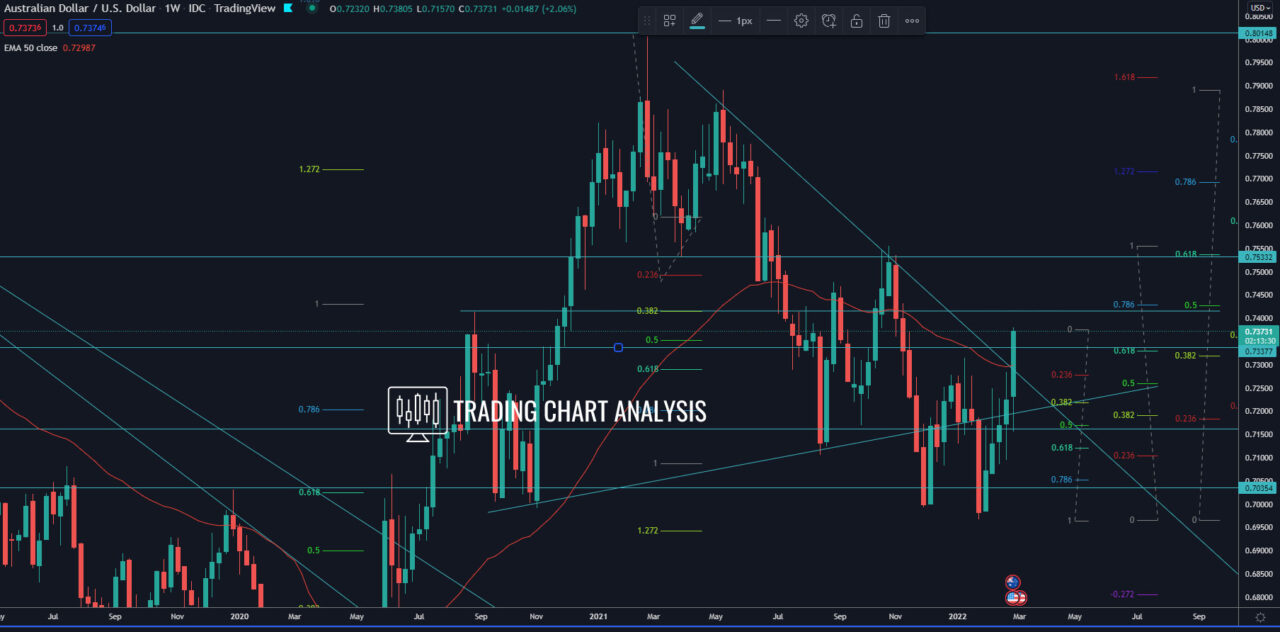
Technical analysis for the AUD/USD, the pair broke above descending trend line on the daily chart and multiple resistance levels, which is a strong bullish signal. The price closed above the high at 0.7315 on the daily chart, above the 200 daily EMA and the 0.382 FIB retracement on the monthly chart at 0.7365, and the 0.618 FIB retracement on the daily chart at 0.7330. The first target for the bullish breakout for the AUD/USD is the 1.272 FIB extension on the daily chart at 0.7440, which is around the 0.786 FIB retracement and 0.500 FIB retracement on the weekly chart at 0.7420. The second target for the AUD/USD is the 1.618 FIB extension on the daily chart at 0.7540, which is just below the high at 0.7556.
The bullish momentum for the AUD/USD reached the resistance at 0.7380, which is the 1.618 FIB extension on the four-hour chart for the latest bullish leg and a top of ascending wedge on the one-hour chart. Therefore we may see a pullback from here. The first target for this potential pullback for the AUD/USD is the support at 0.7315. The second target is the 0.382 FIB retracement on the daily chart at 0.7270. The third target is at the low at 0.7235, which is 0.500 FIB retracement on the daily chart.
Daily chart:

Weekly chart:


