|
Getting your Trinity Audio player ready...
|
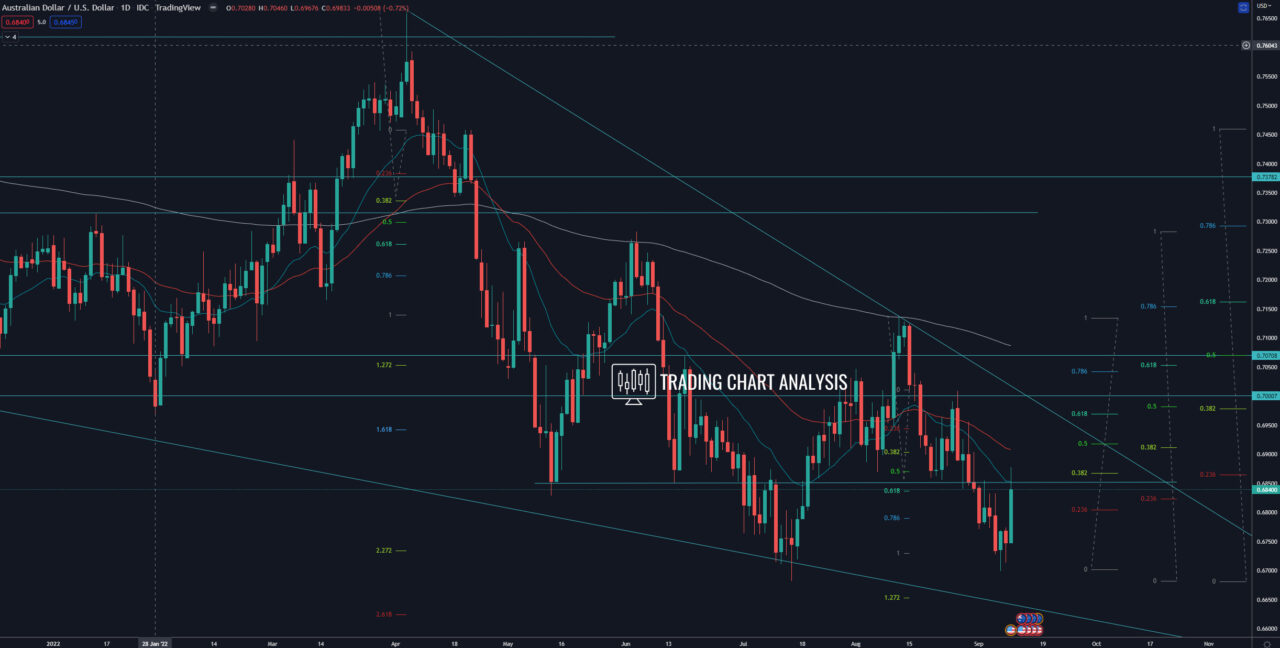
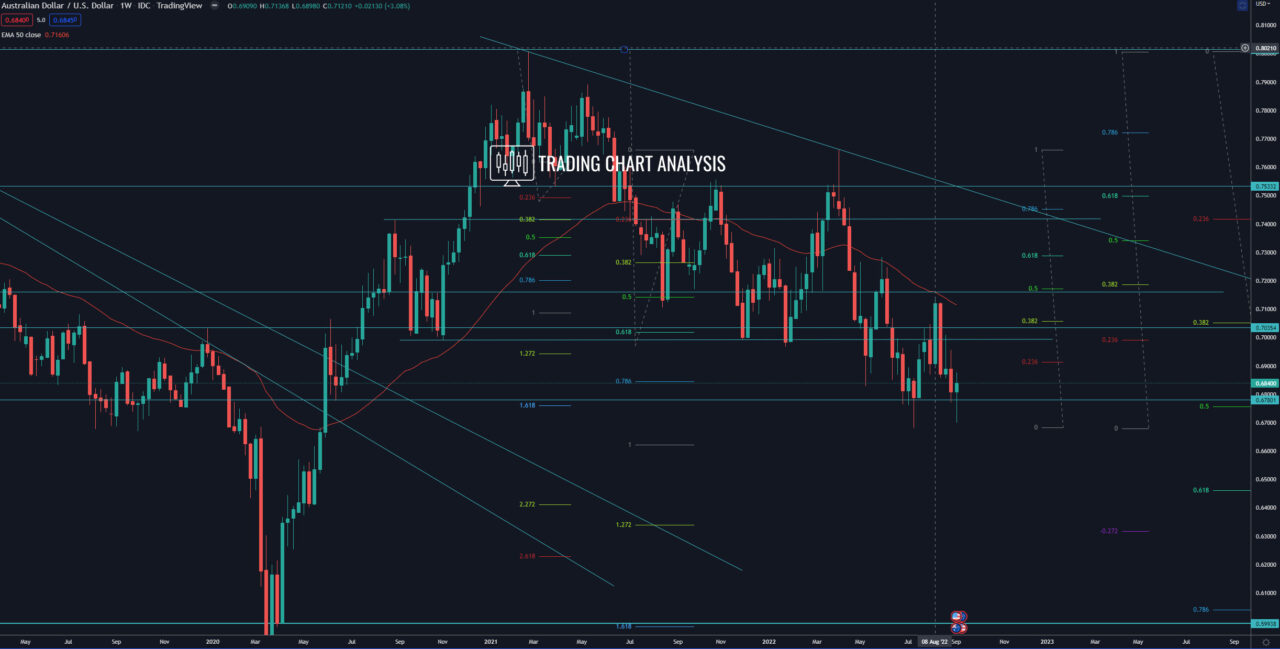
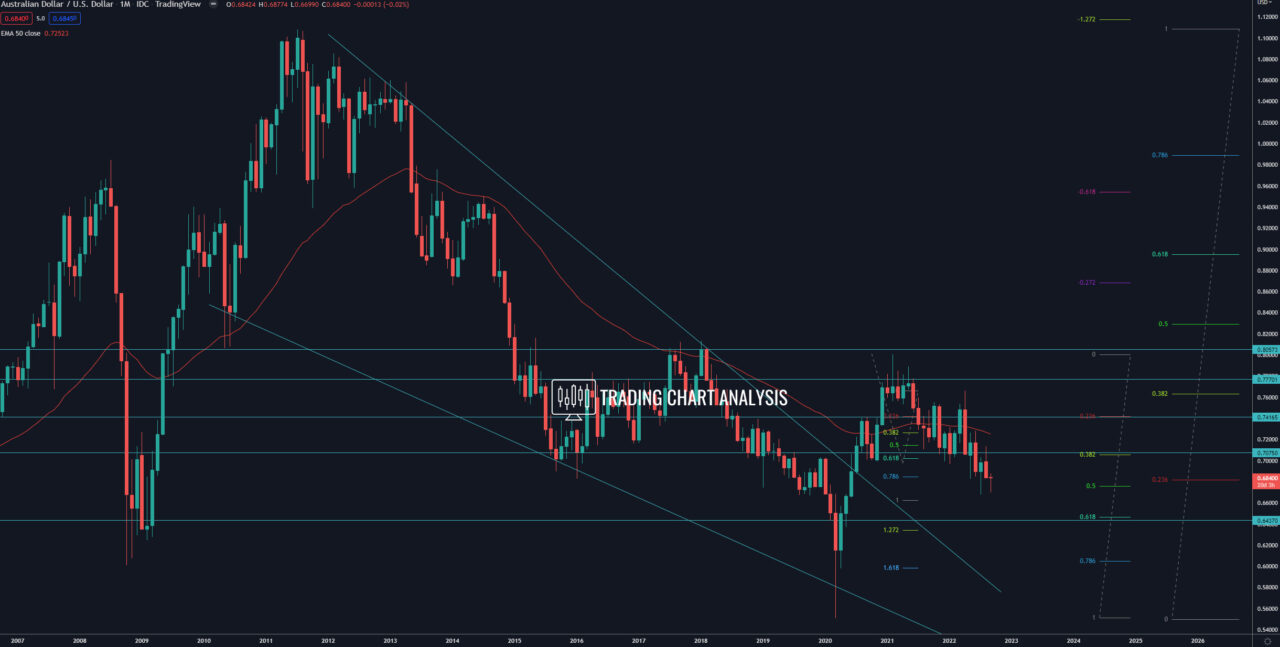
Technical analysis for AUD/USD, the pair formed a double bottom on the weekly chart, rejecting the 0.500 FIB retracement on the monthly chart, signaling a potential bounce. The first target for this bounce is 0.382 FIB retracement on the daily chart at 0.6870 and was reached. The second target is the 0.500 FIB retracement on the daily chart at 0.6920. The third target of the pullback in the AUD/USD is the zone between 0.618 FIB retracement on the daily chart and the resistance between 0.6970-0.7010. If the AUD/USD breaks above the high on the daily chart at 0.7010 that will open the door for a bullish run toward the previous weekly high at 0.7136. And if the AUD/USD pair manages to close above 0.7136 on the weekly chart, that will be a signal for a major change in sentiment.
On the other hand, if the AUD/USD breaks below the double bottom and the low on the weekly chart at 0.6681, that will resume the bearish wave on the weekly chart. The first target for such a bearish development is the 0.618 FIB retracement on the monthly chart at 0.6470. The second target is the first target of the bearish wave on the monthly chart, the 1.272 FIB extension at 0.6350.
Daily chart:

Weekly chart:

Monthly chart:


