|
Getting your Trinity Audio player ready...
|
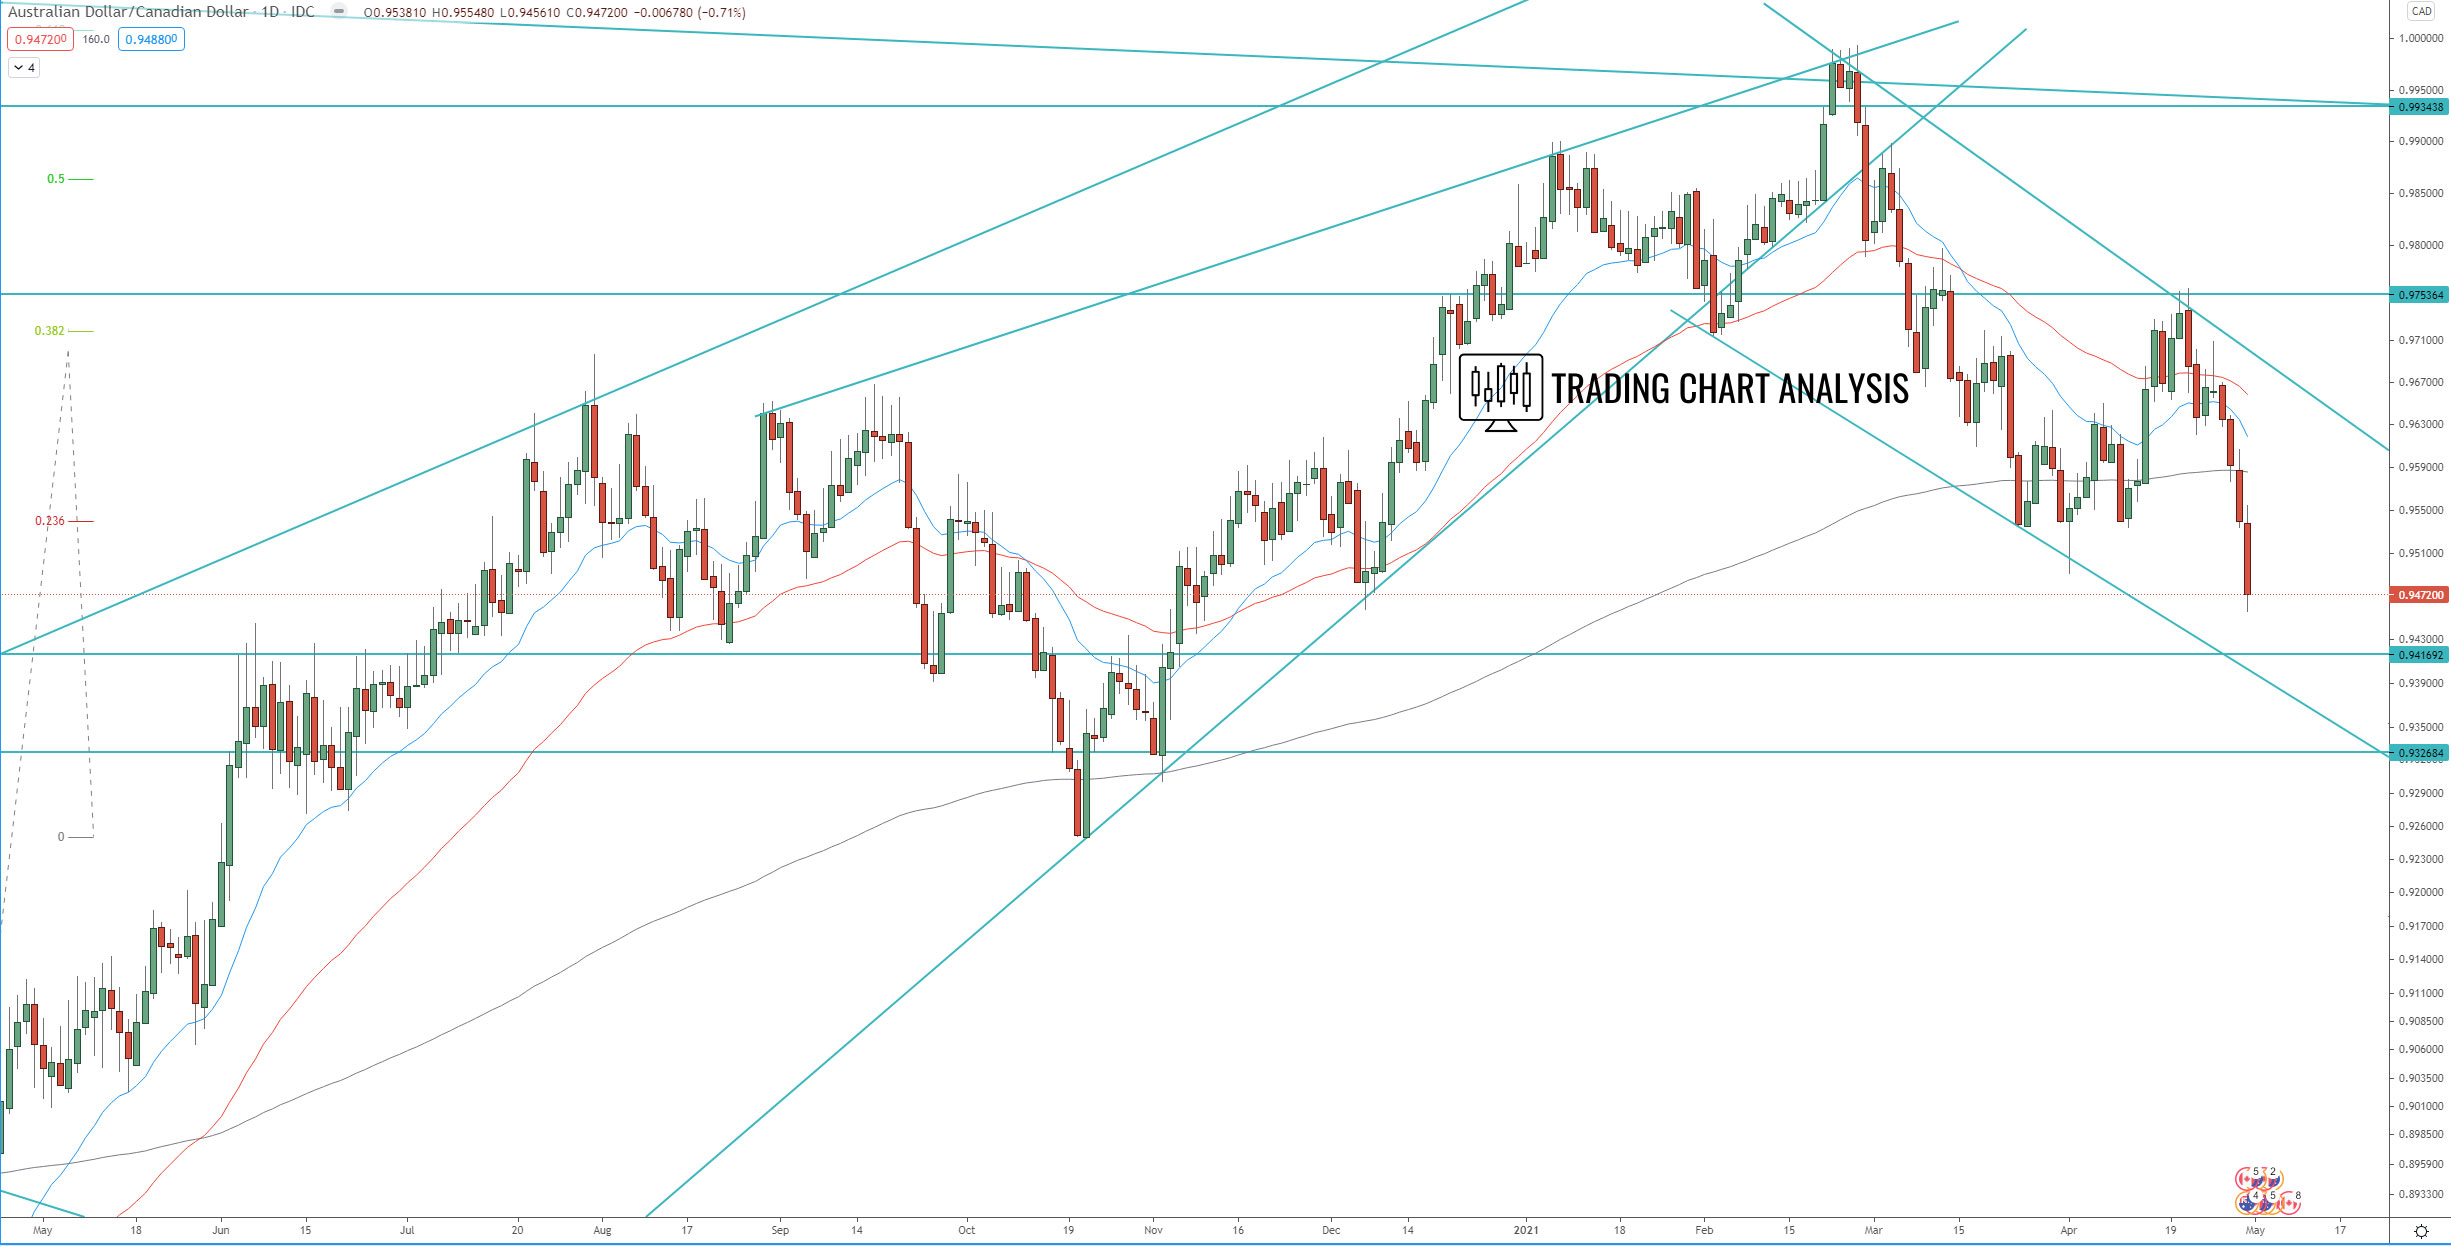
Technical analysis for the AUD/CAD is showing that the price broke down below the previous weekly low, a signal for further downside potential. The first target of this break below 0.9491 is at 1.272 FIB extension at 0.9380, and the second target is at 1.618 FIB extension at 0.9270.
Key resistance for the AUD/CAD now is at 0.9708 and .7559, break above that will invalidate this bearish view and should send the price higher toward the previous high at 0.9934.
Daily chart:
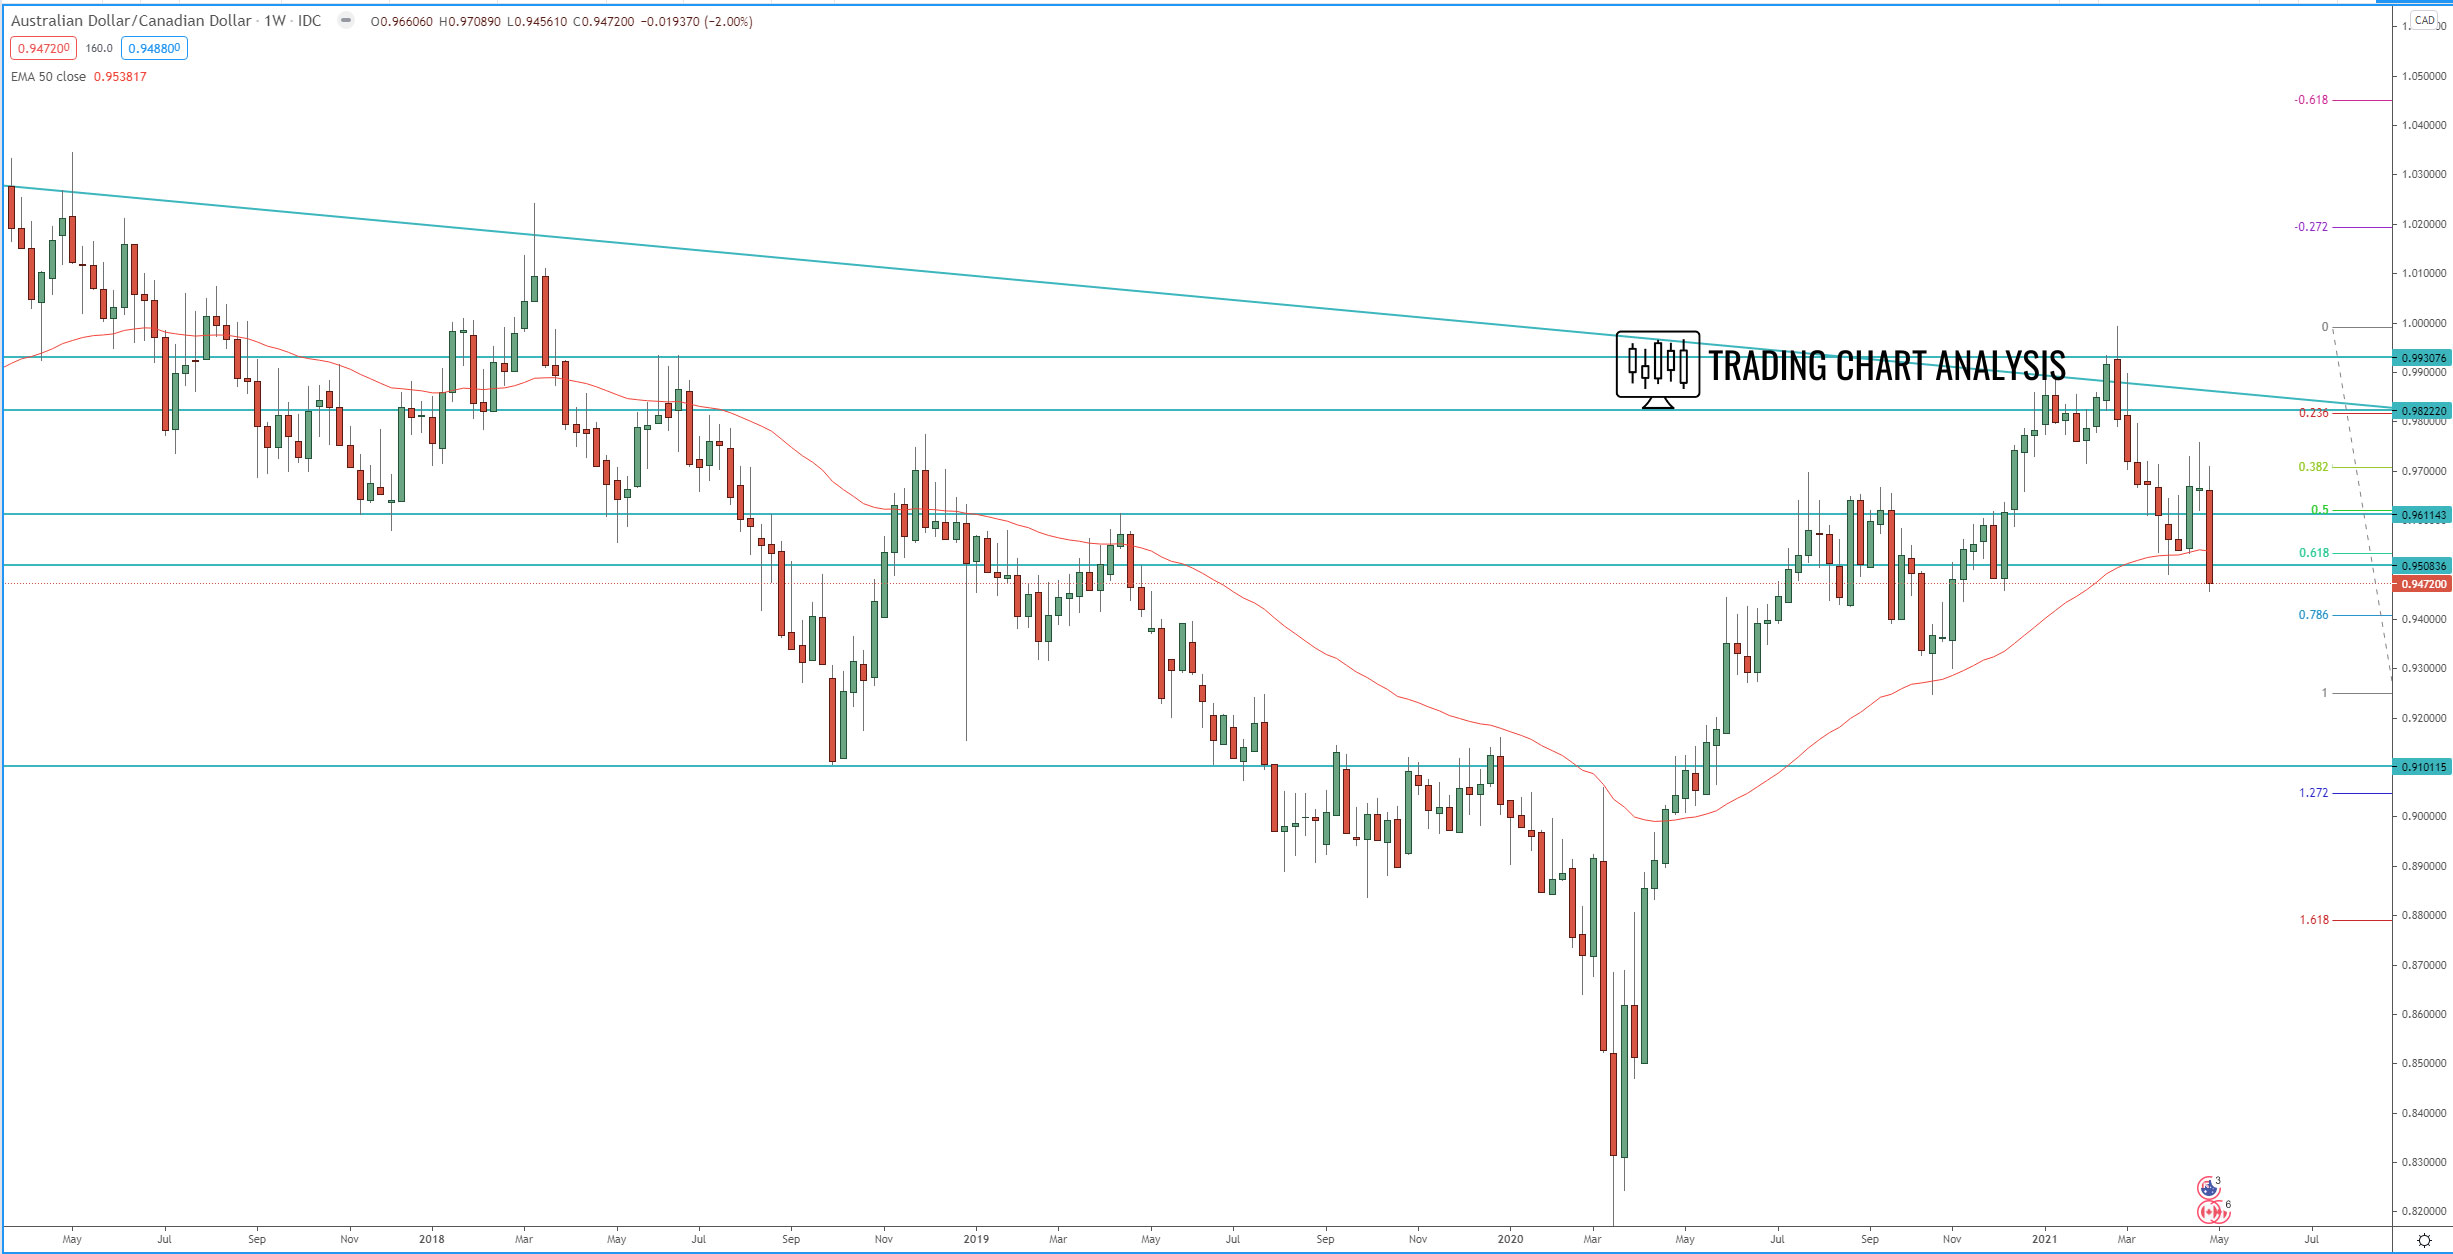
Weekly chart:
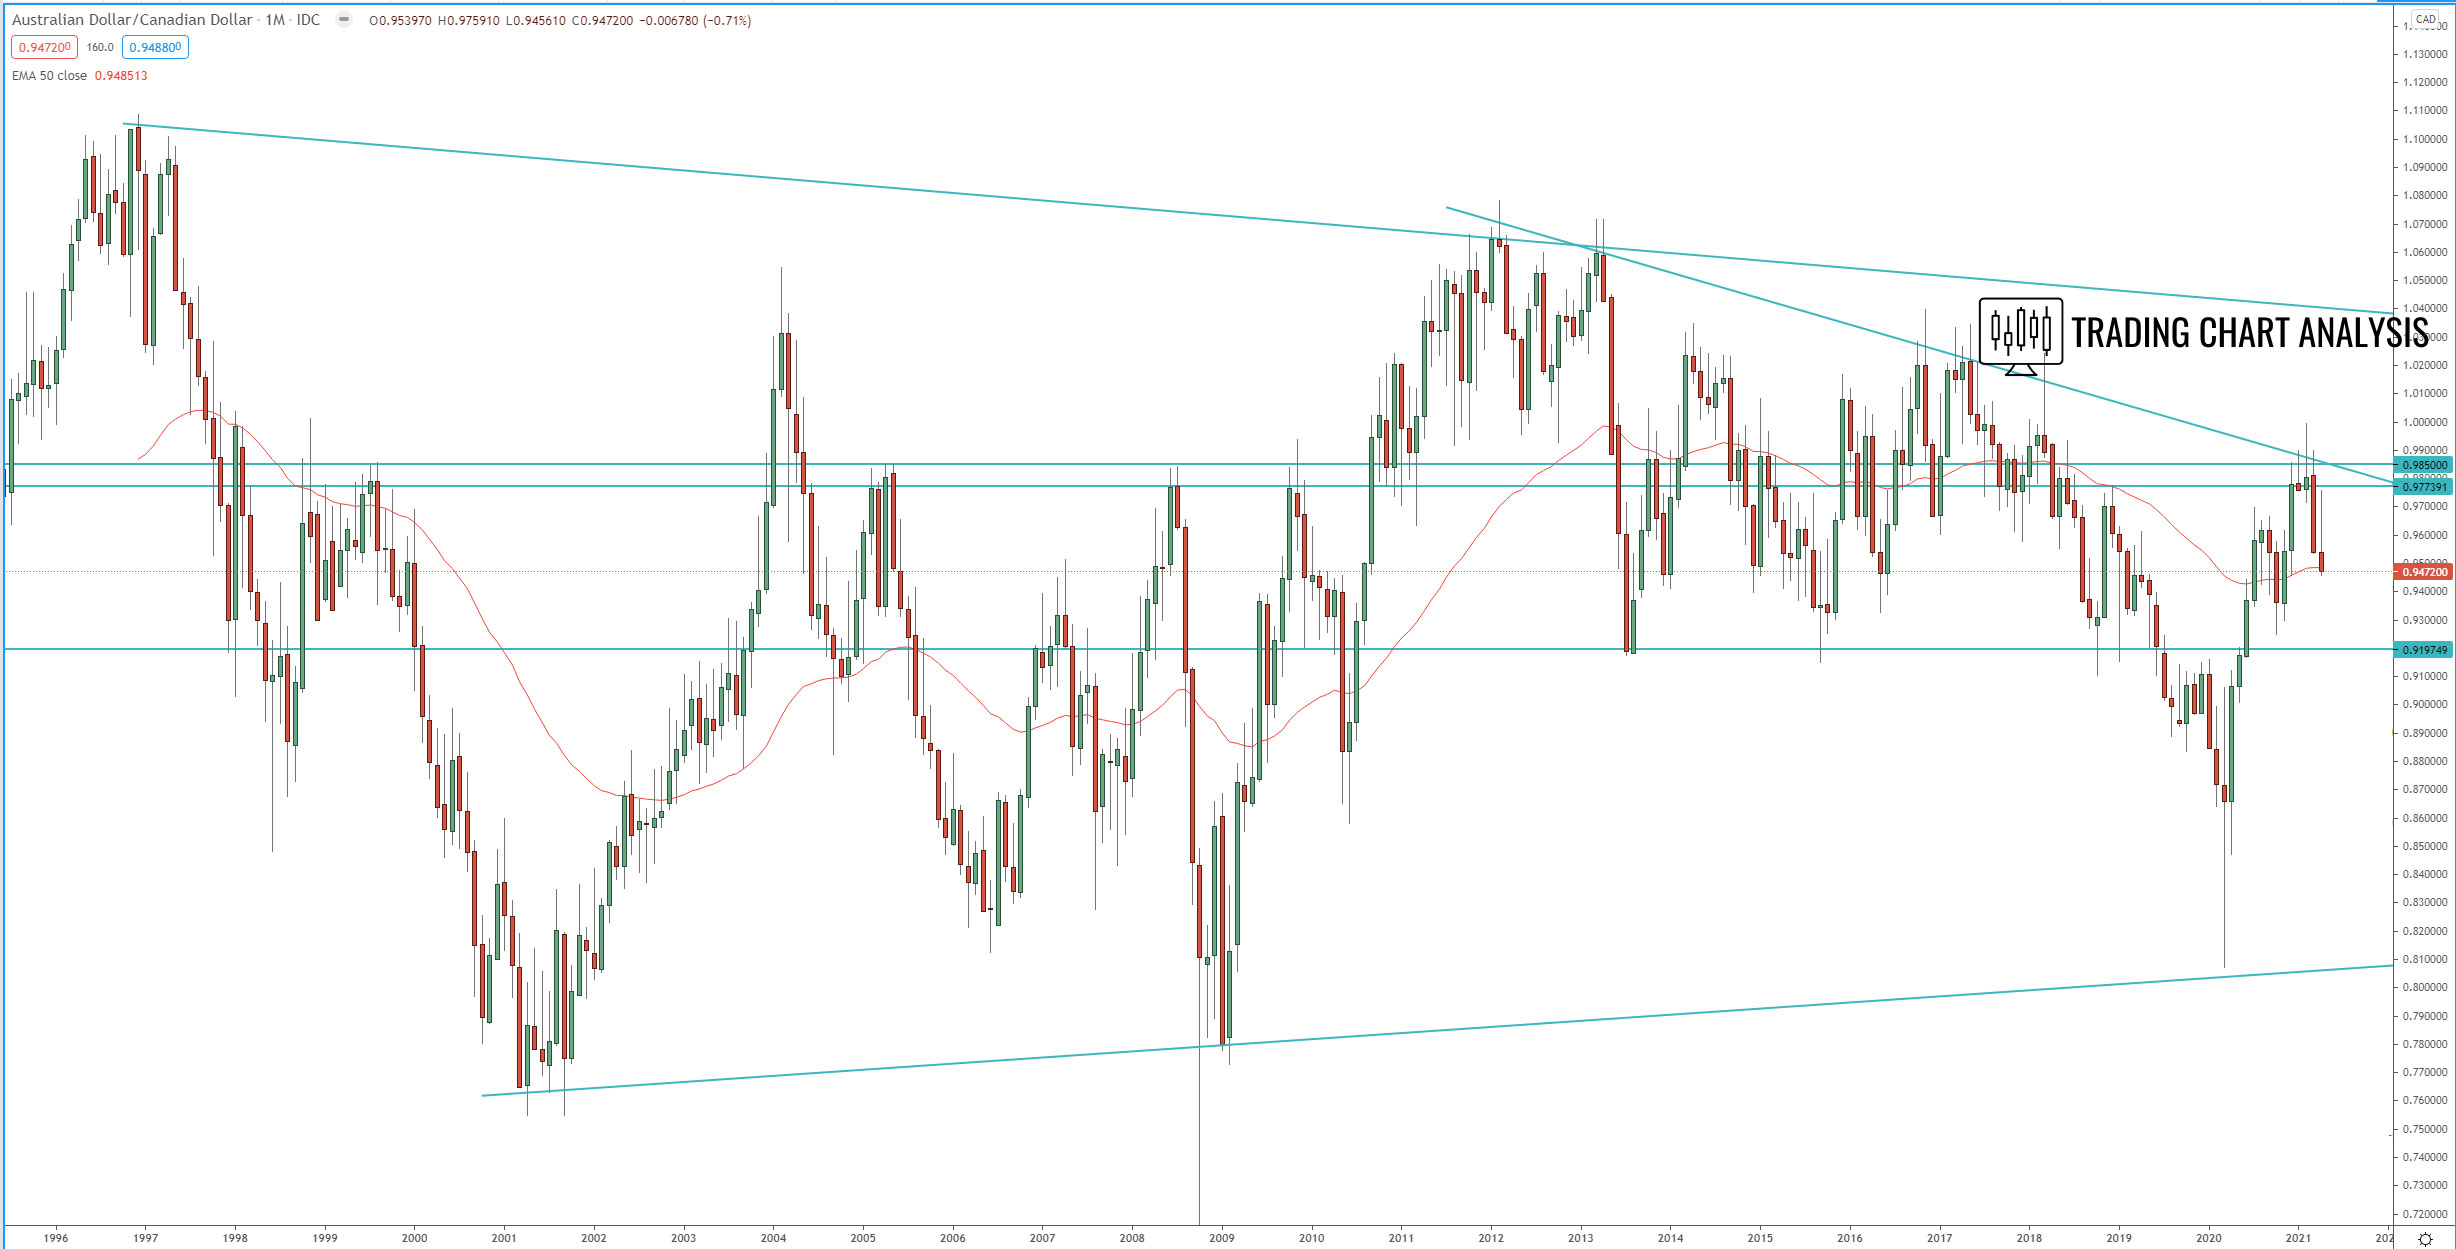
Monthly chart: